

Pola sebenarnya

Double Bottom
was formed on 14.04 at 22:00:04 (UTC+0)
signal strength 3 of 5
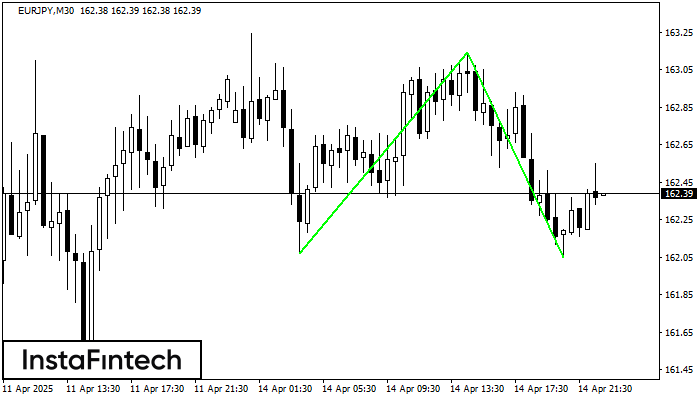
The Double Bottom pattern has been formed on EURJPY M30; the upper boundary is 163.14; the lower boundary is 162.05. The width of the pattern is 107 points. In case of a break of the upper boundary 163.14, a change in the trend can be predicted where the width of the pattern will coincide with the distance to a possible take profit level.
- All
- All
- Bearish Rectangle
- Bearish Symmetrical Triangle
- Bearish Symmetrical Triangle
- Bullish Rectangle
- Double Top
- Double Top
- Triple Bottom
- Triple Bottom
- Triple Top
- Triple Top
- All
- All
- Buy
- Sale
- All
- 1
- 2
- 3
- 4
- 5
Bawah Ganda
was formed on 11.05 at 23:55:31 (UTC+0)
signal strength 1 of 5
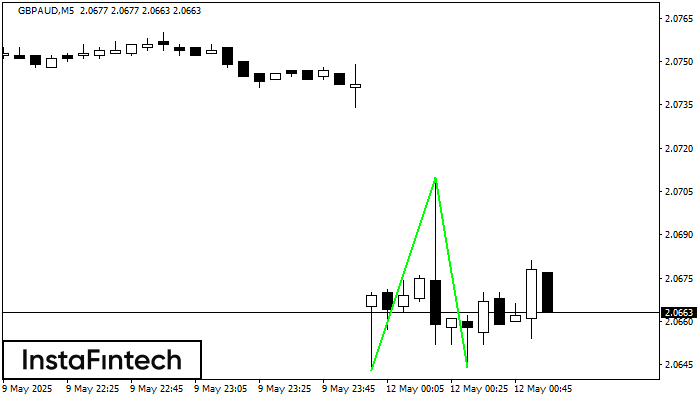
Pola Bawah Ganda telah terbentuk pada GBPAUD M5. Karakteristik: level support 2.0643; level resistance 2.0710; lebar pola 67 poin. Jika level resistance ditembus, perubahan dalam tren dapat diprediksi dengan target
Rangka waktu M5 dan M15 mungkin memiliki lebih dari titik entri yang keliru.
Open chart in a new window
Bendera Bearish
was formed on 11.05 at 23:51:00 (UTC+0)
signal strength 2 of 5
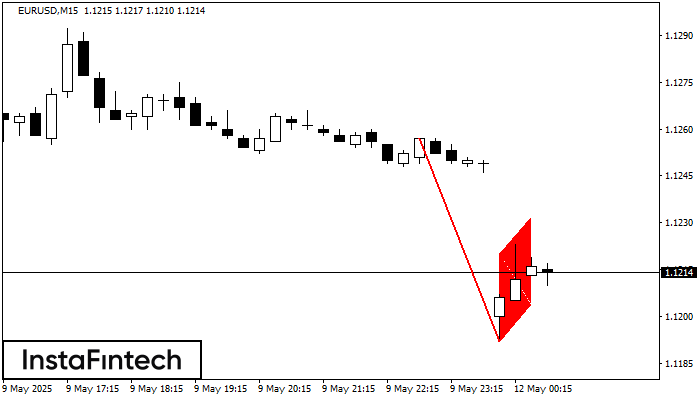
Pola Bendera Bearish telah terbentuk di grafik EURUSD M15, yang memberikan sinyal tren menurun akan berlanjut. Jika harga menembus ke bawah titik terendah di 1.1192, maka kemungkinan besar harga akan
Rangka waktu M5 dan M15 mungkin memiliki lebih dari titik entri yang keliru.
Open chart in a new window
Persegi Bullish
was formed on 11.05 at 23:32:05 (UTC+0)
signal strength 1 of 5

Menurut grafik dari M5, NZDCAD terbentuk Persegi Bullish yang merupakan pola dari kelanjutan tren. Pola terkandung dalam batas berikut: batas yang lebih rendah 0.8222 – 0.8222 dan batas atas 0.8238
Rangka waktu M5 dan M15 mungkin memiliki lebih dari titik entri yang keliru.
Open chart in a new window


