

Pola sebenarnya

Bullish pennant
was formed on 14.04 at 16:00:24 (UTC+0)
signal strength 1 of 5
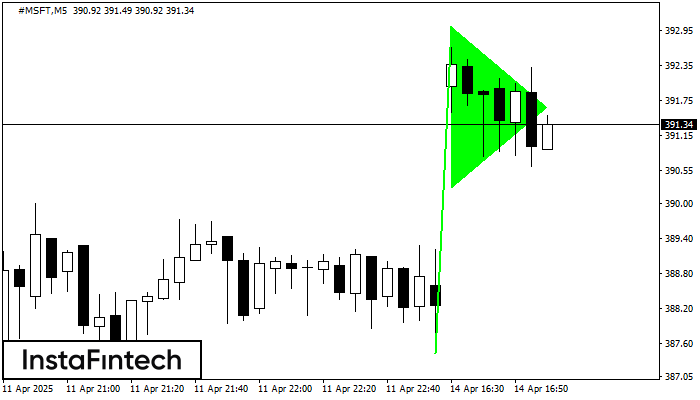
The Bullish pennant pattern is formed on the #MSFT M5 chart. It is a type of the continuation pattern. Supposedly, in case the price is fixed above the pennant’s high of 393.01, a further uptrend is possible.
The M5 and M15 time frames may have more false entry points.
- All
- All
- Bearish Rectangle
- Bearish Symmetrical Triangle
- Bearish Symmetrical Triangle
- Bullish Rectangle
- Double Top
- Double Top
- Triple Bottom
- Triple Bottom
- Triple Top
- Triple Top
- All
- All
- Buy
- Sale
- All
- 1
- 2
- 3
- 4
- 5
Triple Bottom
was formed on 14.05 at 06:25:30 (UTC+0)
signal strength 1 of 5
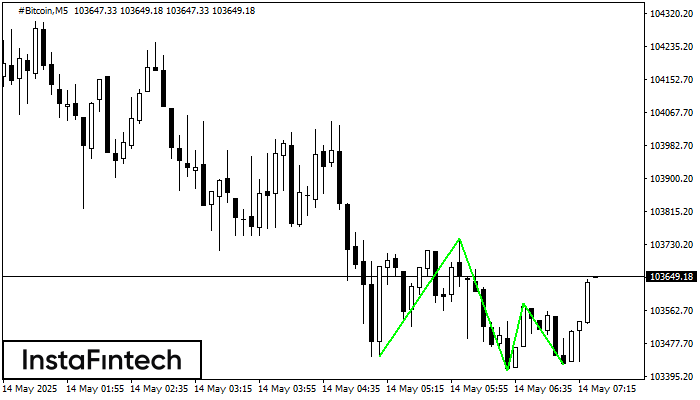
The Triple Bottom pattern has formed on the chart of #Bitcoin M5. Features of the pattern: The lower line of the pattern has coordinates 103747.47 with the upper limit 103747.47/103579.90
The M5 and M15 time frames may have more false entry points.
Open chart in a new window
Double Top
was formed on 14.05 at 06:00:37 (UTC+0)
signal strength 4 of 5
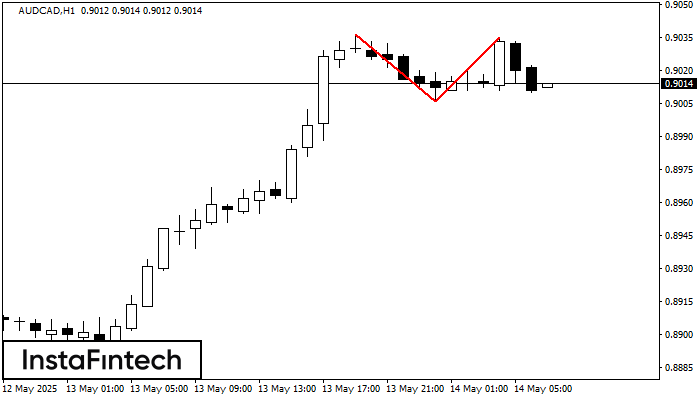
On the chart of AUDCAD H1 the Double Top reversal pattern has been formed. Characteristics: the upper boundary 0.9035; the lower boundary 0.9006; the width of the pattern 29 points
Open chart in a new window
Double Top
was formed on 14.05 at 06:00:37 (UTC+0)
signal strength 3 of 5
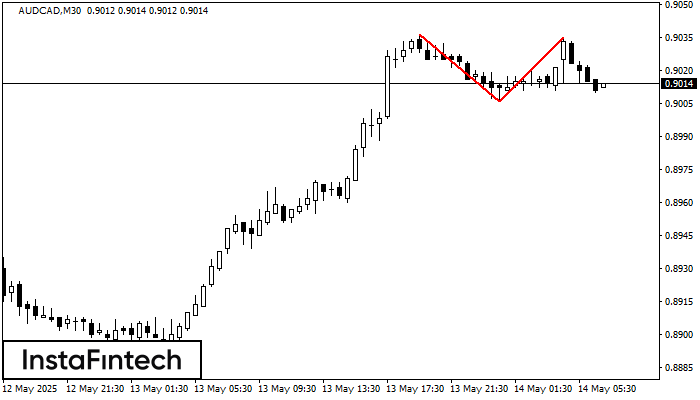
The Double Top reversal pattern has been formed on AUDCAD M30. Characteristics: the upper boundary 0.9036; the lower boundary 0.9006; the width of the pattern is 29 points. Sell trades
Open chart in a new window


