

Pola sebenarnya

Double Top
was formed on 14.04 at 13:25:46 (UTC+0)
signal strength 1 of 5
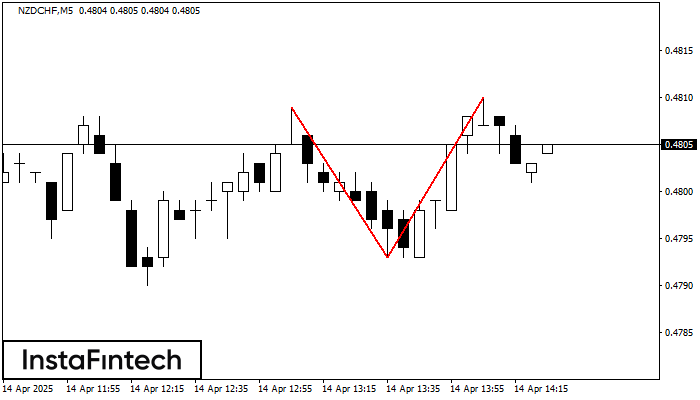
The Double Top reversal pattern has been formed on NZDCHF M5. Characteristics: the upper boundary 0.4809; the lower boundary 0.4793; the width of the pattern is 17 points. Sell trades are better to be opened below the lower boundary 0.4793 with a possible movements towards the 0.4778 level.
The M5 and M15 time frames may have more false entry points.
- All
- All
- Bearish Rectangle
- Bearish Symmetrical Triangle
- Bearish Symmetrical Triangle
- Bullish Rectangle
- Double Top
- Double Top
- Triple Bottom
- Triple Bottom
- Triple Top
- Triple Top
- All
- All
- Buy
- Sale
- All
- 1
- 2
- 3
- 4
- 5
Double Bottom
was formed on 16.05 at 10:30:35 (UTC+0)
signal strength 3 of 5
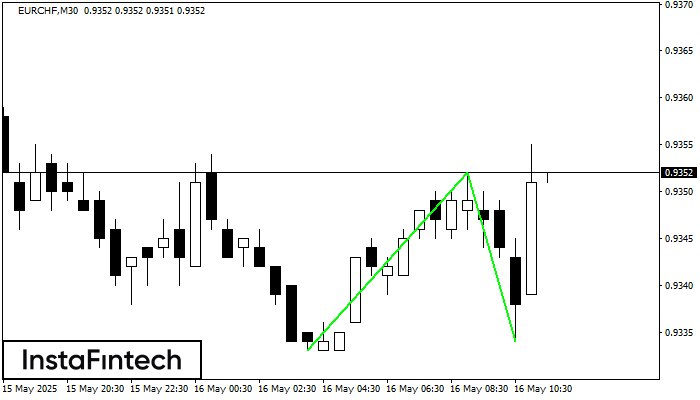
The Double Bottom pattern has been formed on EURCHF M30. Characteristics: the support level 0.9333; the resistance level 0.9352; the width of the pattern 19 points. If the resistance level
Open chart in a new window
Double Bottom
was formed on 16.05 at 10:30:22 (UTC+0)
signal strength 3 of 5
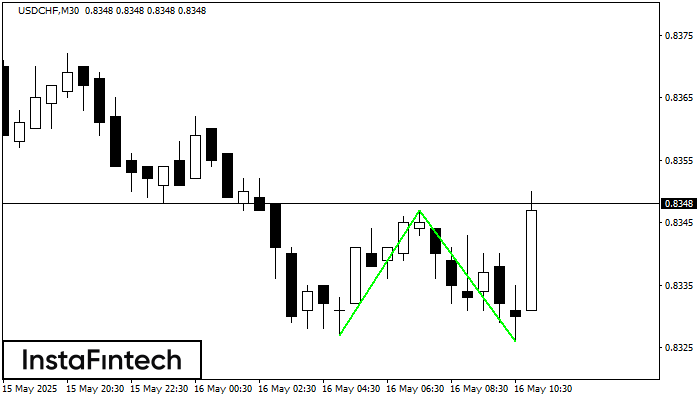
The Double Bottom pattern has been formed on USDCHF M30. Characteristics: the support level 0.8327; the resistance level 0.8347; the width of the pattern 20 points. If the resistance level
Open chart in a new window
Double Bottom
was formed on 16.05 at 10:30:22 (UTC+0)
signal strength 3 of 5
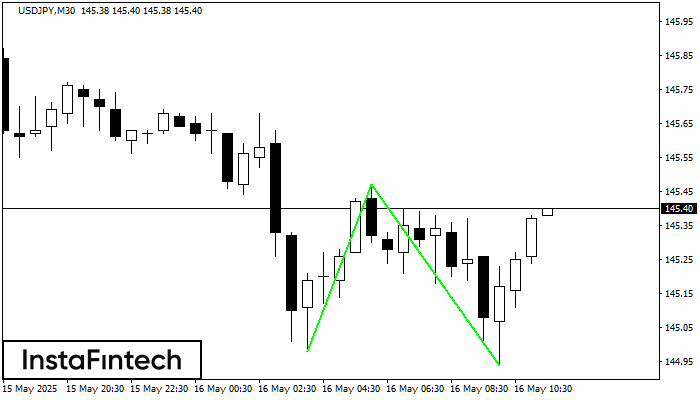
The Double Bottom pattern has been formed on USDJPY M30; the upper boundary is 145.47; the lower boundary is 144.94. The width of the pattern is 49 points. In case
Open chart in a new window


