

Pola sebenarnya

Double Bottom
was formed on 14.04 at 13:00:23 (UTC+0)
signal strength 4 of 5
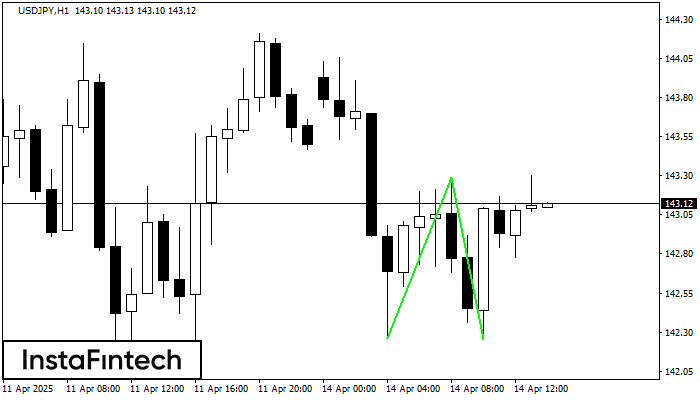
The Double Bottom pattern has been formed on USDJPY H1. Characteristics: the support level 142.26; the resistance level 143.29; the width of the pattern 103 points. If the resistance level is broken, a change in the trend can be predicted with the first target point lying at the distance of 104 points.
Lihat juga
- All
- All
- Bearish Rectangle
- Bearish Symmetrical Triangle
- Bearish Symmetrical Triangle
- Bullish Rectangle
- Double Top
- Double Top
- Triple Bottom
- Triple Bottom
- Triple Top
- Triple Top
- All
- All
- Buy
- Sale
- All
- 1
- 2
- 3
- 4
- 5
Kepala dan Bahu Terbalik
was formed on 09.05 at 08:00:23 (UTC+0)
signal strength 2 of 5
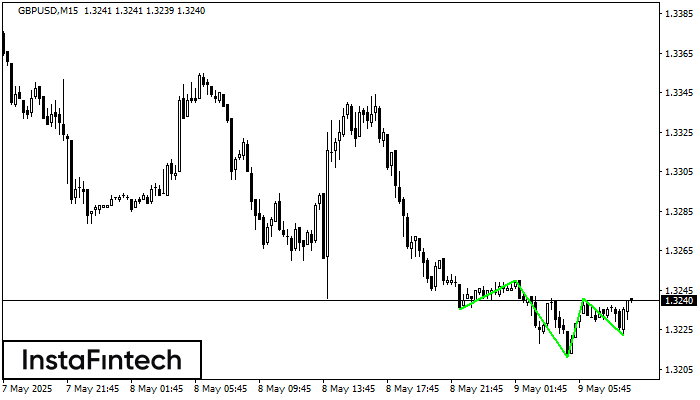
Menurut grafik M15, GBPUSD menghasilkan pola yang disebut Kepala dan Bahu Terbalik. The Head ditetapkan di 1.3211 sementara garis median The Neck ditetapkan di 1.3250/1.3241. Formasi Pola Kepala dan Bahu
Rangka waktu M5 dan M15 mungkin memiliki lebih dari titik entri yang keliru.
Open chart in a new window
Bawah Ganda
was formed on 09.05 at 08:00:13 (UTC+0)
signal strength 2 of 5
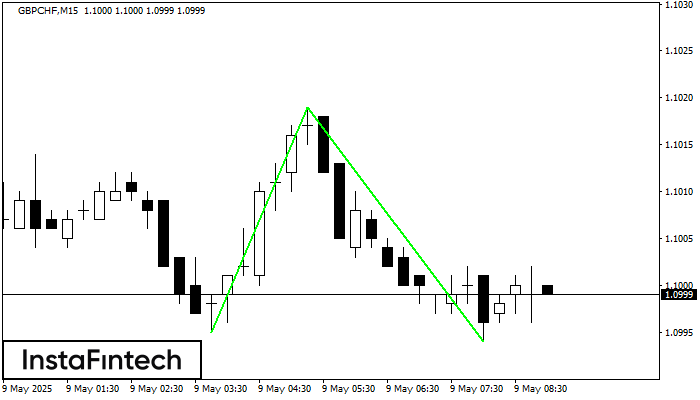
Pola Bawah Ganda telah terbentuk pada GBPCHF M15; batas atas di 1.1019; batas bawah di 1.0994. Lebar pola sebesar 24 poin. Jika harga menembus batas atas 1.1019, Perubahan dalam tren
Rangka waktu M5 dan M15 mungkin memiliki lebih dari titik entri yang keliru.
Open chart in a new window
Kepala dan Bahu Terbalik
was formed on 09.05 at 08:00:07 (UTC+0)
signal strength 2 of 5
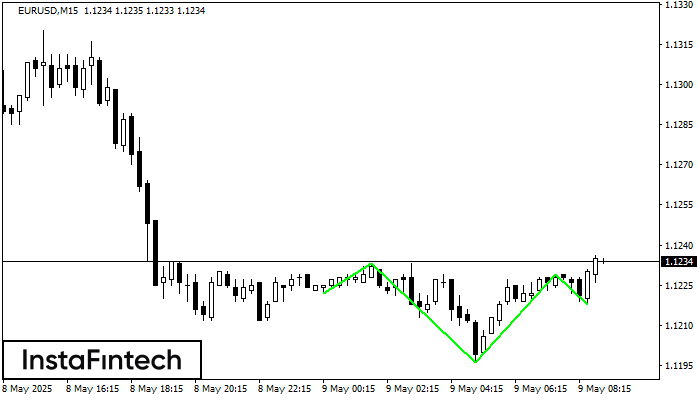
Menurut M15, EURUSD membentuk pola teknikal – Kepala dan Bahu Terbalik. Jika garis leher (Neckline) 1.1233/1.1229 ditembus, maka instrumen ini kemungkinan akan bergerak menuju 1.1251
Rangka waktu M5 dan M15 mungkin memiliki lebih dari titik entri yang keliru.
Open chart in a new window


