

Pola sebenarnya

Triple Top
was formed on 11.04 at 21:40:18 (UTC+0)
signal strength 1 of 5
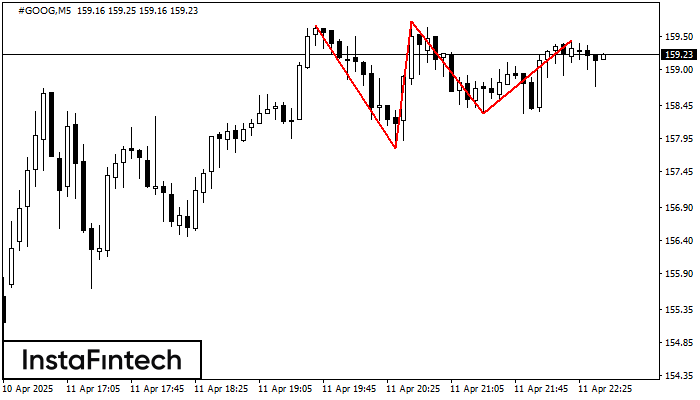
The Triple Top pattern has formed on the chart of the #GOOG M5 trading instrument. It is a reversal pattern featuring the following characteristics: resistance level 23, support level -53, and pattern’s width 187. Forecast If the price breaks through the support level 157.80, it is likely to move further down to 159.58.
The M5 and M15 time frames may have more false entry points.
- All
- All
- Bearish Rectangle
- Bearish Symmetrical Triangle
- Bearish Symmetrical Triangle
- Bullish Rectangle
- Double Top
- Double Top
- Triple Bottom
- Triple Bottom
- Triple Top
- Triple Top
- All
- All
- Buy
- Sale
- All
- 1
- 2
- 3
- 4
- 5
Double Top
сформирован 12.05 в 16:25:19 (UTC+0)
сила сигнала 1 из 5
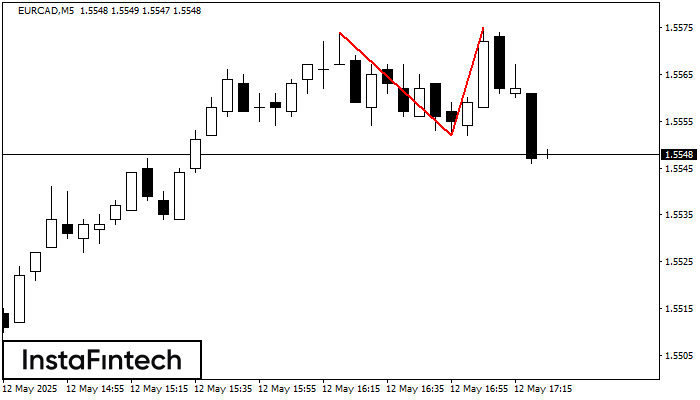
The Double Top reversal pattern has been formed on EURCAD M5. Characteristics: the upper boundary 1.5574; the lower boundary 1.5552; the width of the pattern is 23 points. Sell trades
The M5 and M15 time frames may have more false entry points.
Открыть график инструмента в новом окне
Bullish Rectangle
сформирован 12.05 в 16:15:07 (UTC+0)
сила сигнала 2 из 5
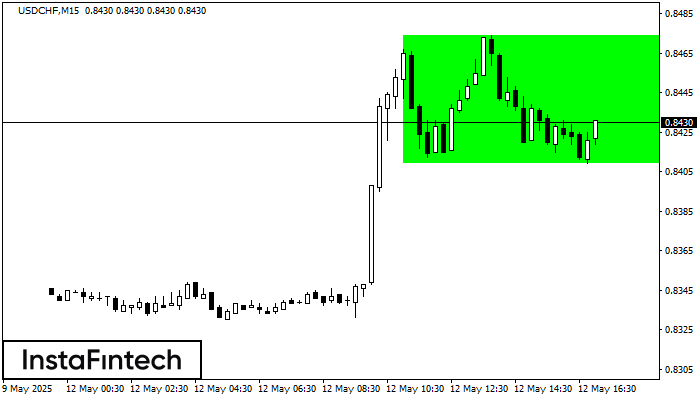
According to the chart of M15, USDCHF formed the Bullish Rectangle. The pattern indicates a trend continuation. The upper border is 0.8474, the lower border is 0.8409. The signal means
The M5 and M15 time frames may have more false entry points.
Открыть график инструмента в новом окне
Double Bottom
сформирован 12.05 в 16:05:36 (UTC+0)
сила сигнала 1 из 5
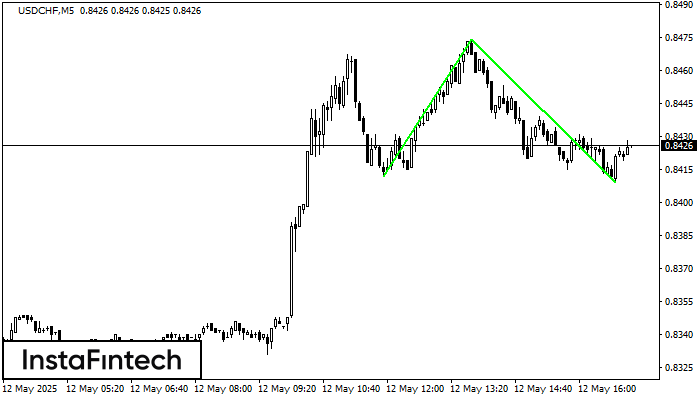
The Double Bottom pattern has been formed on USDCHF M5. This formation signals a reversal of the trend from downwards to upwards. The signal is that a buy trade should
The M5 and M15 time frames may have more false entry points.
Открыть график инструмента в новом окне

