

Pola sebenarnya

Triple Top
was formed on 08.04 at 01:40:24 (UTC+0)
signal strength 1 of 5
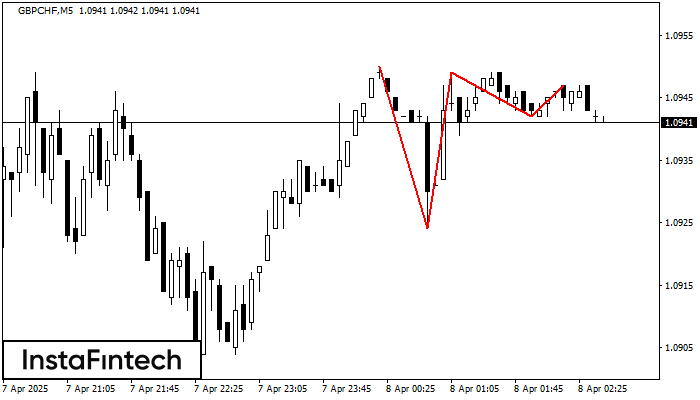
On the chart of the GBPCHF M5 trading instrument, the Triple Top pattern that signals a trend change has formed. It is possible that after formation of the third peak, the price will try to break through the resistance level 1.0924, where we advise to open a trading position for sale. Take profit is the projection of the pattern’s width, which is 26 points.
The M5 and M15 time frames may have more false entry points.
Lihat juga
- All
- All
- Bearish Rectangle
- Bearish Symmetrical Triangle
- Bearish Symmetrical Triangle
- Bullish Rectangle
- Double Top
- Double Top
- Triple Bottom
- Triple Bottom
- Triple Top
- Triple Top
- All
- All
- Buy
- Sale
- All
- 1
- 2
- 3
- 4
- 5
Bearish Symmetrical Triangle
was formed on 23.04 at 10:19:08 (UTC+0)
signal strength 1 of 5

According to the chart of M5, AUDJPY formed the Bearish Symmetrical Triangle pattern. Trading recommendations: A breach of the lower border 90.60 is likely to encourage a continuation
The M5 and M15 time frames may have more false entry points.
Open chart in a new window
Bullish Symmetrical Triangle
was formed on 23.04 at 07:41:10 (UTC+0)
signal strength 1 of 5

According to the chart of M5, NZDJPY formed the Bullish Symmetrical Triangle pattern, which signals the trend will continue. Description. The upper border of the pattern touches the coordinates 85.07/84.81
The M5 and M15 time frames may have more false entry points.
Open chart in a new window
Double Top
was formed on 23.04 at 07:15:07 (UTC+0)
signal strength 2 of 5
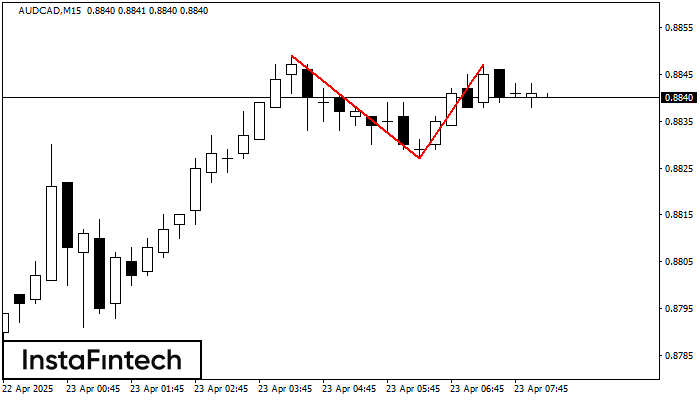
The Double Top pattern has been formed on AUDCAD M15. It signals that the trend has been changed from upwards to downwards. Probably, if the base of the pattern 0.8827
The M5 and M15 time frames may have more false entry points.
Open chart in a new window


