

Pola sebenarnya

Head and Shoulders
was formed on 07.04 at 16:09:55 (UTC+0)
signal strength 1 of 5

According to the chart of M5, AUDCAD formed the Head and Shoulders pattern. The Head’s top is set at 0.8678 while the median line of the Neck is found at 0.8595/0.8604. The formation of the Head and Shoulders pattern evidently signals a reversal of the upward trend. In other words, in case the scenario comes true, the price of AUDCAD will go towards 0.8589.
The M5 and M15 time frames may have more false entry points.
- All
- All
- Bearish Rectangle
- Bearish Symmetrical Triangle
- Bearish Symmetrical Triangle
- Bullish Rectangle
- Double Top
- Double Top
- Triple Bottom
- Triple Bottom
- Triple Top
- Triple Top
- All
- All
- Buy
- Sale
- All
- 1
- 2
- 3
- 4
- 5
Double Top
was formed on 14.05 at 02:15:18 (UTC+0)
signal strength 2 of 5
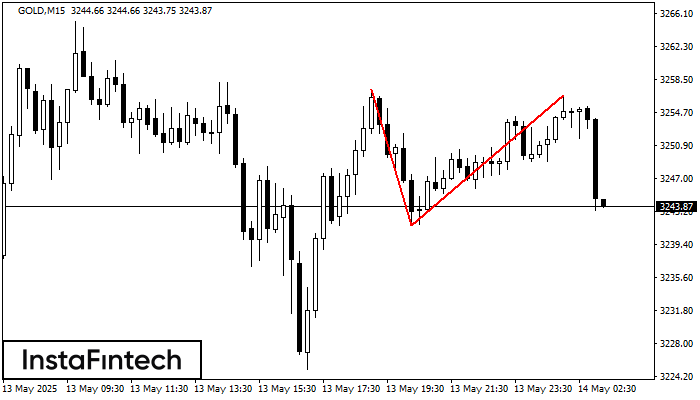
The Double Top reversal pattern has been formed on GOLD M15. Characteristics: the upper boundary 3257.36; the lower boundary 3241.62; the width of the pattern is 1504 points. Sell trades
The M5 and M15 time frames may have more false entry points.
Open chart in a new window
Bearish Symmetrical Triangle
was formed on 14.05 at 01:53:00 (UTC+0)
signal strength 1 of 5
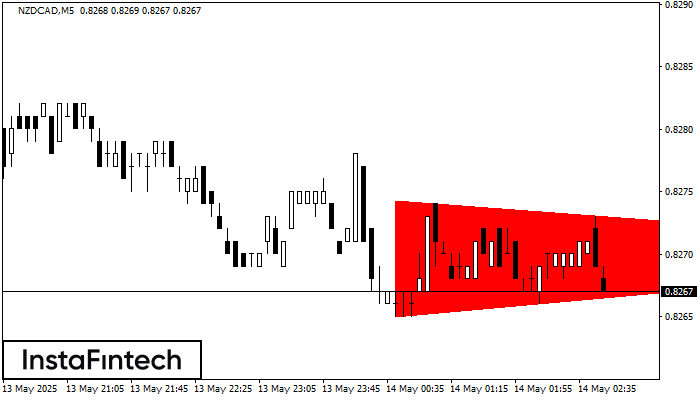
According to the chart of M5, NZDCAD formed the Bearish Symmetrical Triangle pattern. This pattern signals a further downward trend in case the lower border 0.8265 is breached. Here
The M5 and M15 time frames may have more false entry points.
Open chart in a new window
Double Top
was formed on 14.05 at 00:30:22 (UTC+0)
signal strength 3 of 5
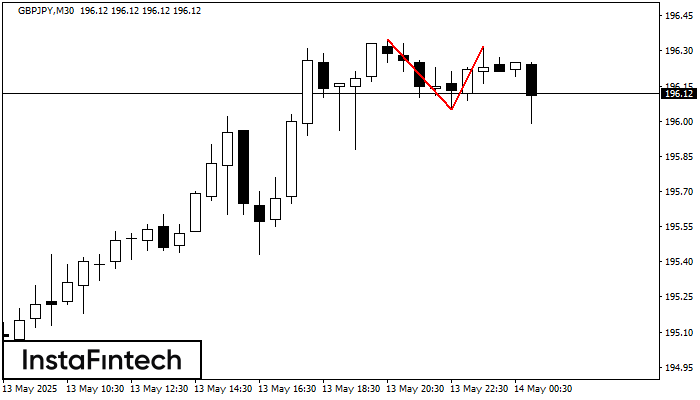
On the chart of GBPJPY M30 the Double Top reversal pattern has been formed. Characteristics: the upper boundary 196.32; the lower boundary 196.05; the width of the pattern 27 points
Open chart in a new window

