

Pola sebenarnya

Triple Bottom
was formed on 04.04 at 11:25:26 (UTC+0)
signal strength 1 of 5
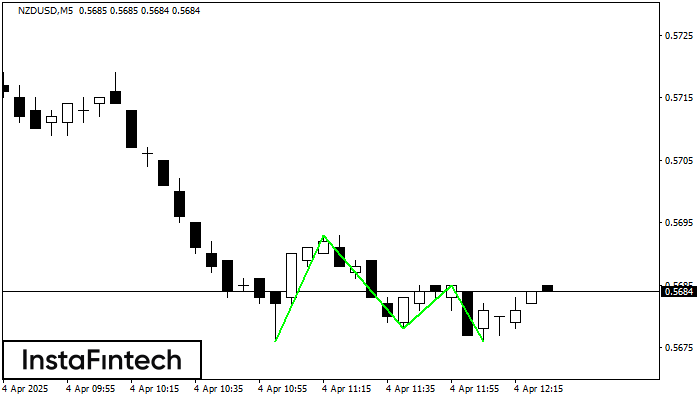
The Triple Bottom pattern has been formed on NZDUSD M5. It has the following characteristics: resistance level 0.5693/0.5685; support level 0.5676/0.5676; the width is 17 points. In the event of a breakdown of the resistance level of 0.5693, the price is likely to continue an upward movement at least to 0.5693.
The M5 and M15 time frames may have more false entry points.
- All
- All
- Bearish Rectangle
- Bearish Symmetrical Triangle
- Bearish Symmetrical Triangle
- Bullish Rectangle
- Double Top
- Double Top
- Triple Bottom
- Triple Bottom
- Triple Top
- Triple Top
- All
- All
- Buy
- Sale
- All
- 1
- 2
- 3
- 4
- 5
Triple Bottom
was formed on 08.05 at 19:55:21 (UTC+0)
signal strength 1 of 5
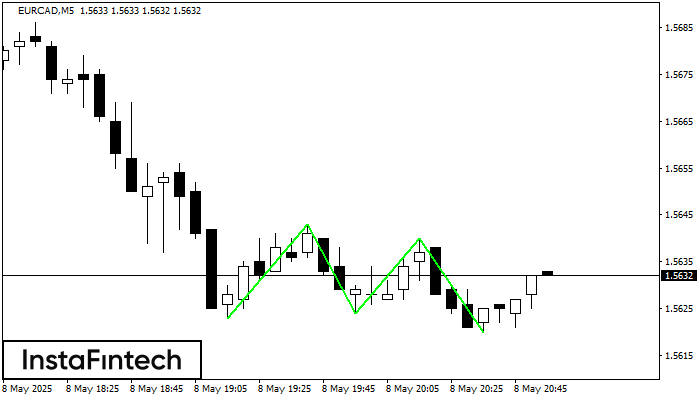
The Triple Bottom pattern has formed on the chart of the EURCAD M5 trading instrument. The pattern signals a change in the trend from downwards to upwards in the case
The M5 and M15 time frames may have more false entry points.
Open chart in a new window
Double Top
was formed on 08.05 at 19:50:48 (UTC+0)
signal strength 1 of 5
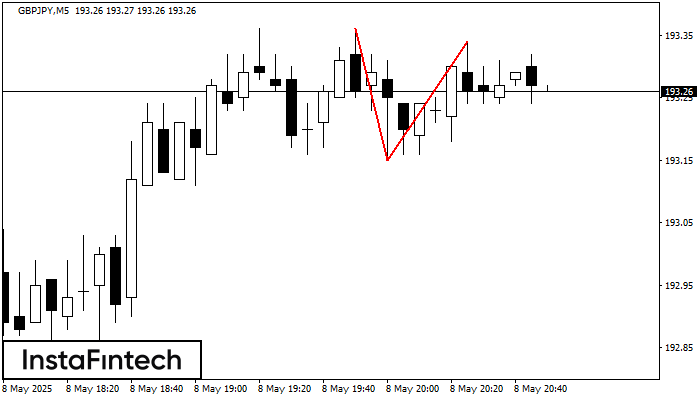
The Double Top reversal pattern has been formed on GBPJPY M5. Characteristics: the upper boundary 193.36; the lower boundary 193.15; the width of the pattern is 19 points. Sell trades
The M5 and M15 time frames may have more false entry points.
Open chart in a new window
Double Bottom
was formed on 08.05 at 19:50:44 (UTC+0)
signal strength 1 of 5
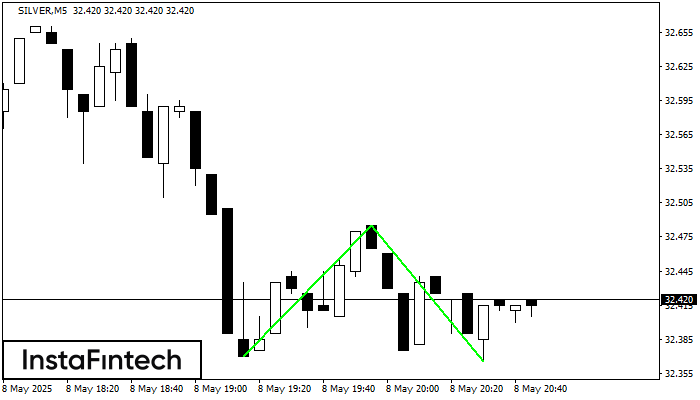
The Double Bottom pattern has been formed on SILVER M5; the upper boundary is 32.48; the lower boundary is 32.37. The width of the pattern is 115 points. In case
The M5 and M15 time frames may have more false entry points.
Open chart in a new window


