

Pola sebenarnya

Triple Bottom
was formed on 04.04 at 10:00:05 (UTC+0)
signal strength 4 of 5
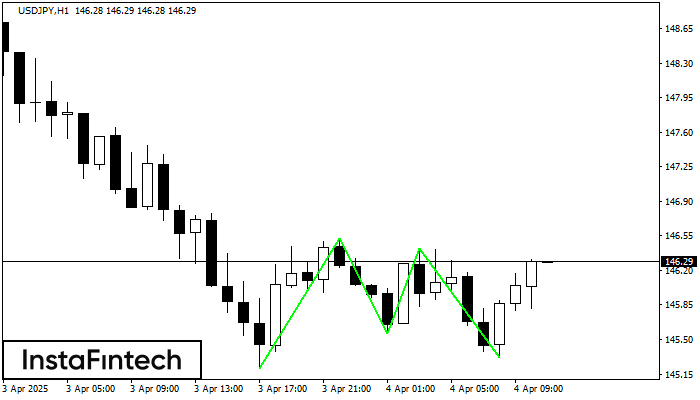
The Triple Bottom pattern has been formed on USDJPY H1. It has the following characteristics: resistance level 146.52/146.42; support level 145.21/145.32; the width is 131 points. In the event of a breakdown of the resistance level of 146.52, the price is likely to continue an upward movement at least to 145.96.
- All
- All
- Bearish Rectangle
- Bearish Symmetrical Triangle
- Bearish Symmetrical Triangle
- Bullish Rectangle
- Double Top
- Double Top
- Triple Bottom
- Triple Bottom
- Triple Top
- Triple Top
- All
- All
- Buy
- Sale
- All
- 1
- 2
- 3
- 4
- 5
Persegi Bullish
was formed on 11.05 at 01:12:20 (UTC+0)
signal strength 1 of 5

Menurut grafik dari M5, #Bitcoin terbentuk Persegi Bullish. Pola menunjukkan kelanjutan tren. Batas atas adalah 103800.29, batas lebih rendah adalah 103508.08. Sinyal berarti posisi beli harus dibuka diatas batas atas
Rangka waktu M5 dan M15 mungkin memiliki lebih dari titik entri yang keliru.
Open chart in a new window
Teratas Ganda
was formed on 11.05 at 00:45:18 (UTC+0)
signal strength 1 of 5

Pada grafik #Bitcoin M5 pola reversal Teratas Ganda telah terbentuk. Karakteristik: batas atas 103800.29; batas bawah 103508.08; lebar pola 29221 poin. Sinyal: tembusan ke batas bawah akan menyebabkan kelanjutan tren
Rangka waktu M5 dan M15 mungkin memiliki lebih dari titik entri yang keliru.
Open chart in a new window
Persegi Bullish
was formed on 09.05 at 22:57:29 (UTC+0)
signal strength 1 of 5

Menurut grafik dari M5, GBPJPY terbentuk Persegi Bullish. Pola menunjukkan kelanjutan tren. Batas atas adalah 193.44, batas lebih rendah adalah 193.24. Sinyal berarti posisi beli harus dibuka diatas batas atas
Rangka waktu M5 dan M15 mungkin memiliki lebih dari titik entri yang keliru.
Open chart in a new window


