

Pola sebenarnya

Double Bottom
was formed on 04.04 at 03:00:34 (UTC+0)
signal strength 4 of 5
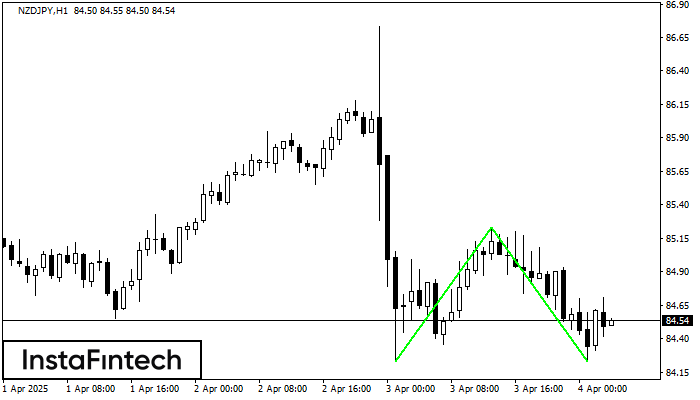
The Double Bottom pattern has been formed on NZDJPY H1; the upper boundary is 85.23; the lower boundary is 84.23. The width of the pattern is 100 points. In case of a break of the upper boundary 85.23, a change in the trend can be predicted where the width of the pattern will coincide with the distance to a possible take profit level.
- All
- All
- Bearish Rectangle
- Bearish Symmetrical Triangle
- Bearish Symmetrical Triangle
- Bullish Rectangle
- Double Top
- Double Top
- Triple Bottom
- Triple Bottom
- Triple Top
- Triple Top
- All
- All
- Buy
- Sale
- All
- 1
- 2
- 3
- 4
- 5
Teratas Ganda
was formed on 12.05 at 16:25:19 (UTC+0)
signal strength 1 of 5
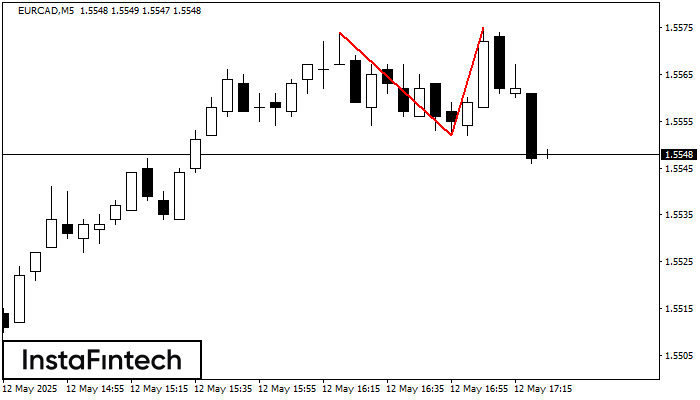
Pola reversal Teratas Ganda telah terbentuk pada EURCAD M5. Karakteristik: batas atas 1.5574; batas bawah 1.5552; lebar pola 23 poin. Transaksi jual lebih baik dibuka di bawah batas bawah 1.5552
Rangka waktu M5 dan M15 mungkin memiliki lebih dari titik entri yang keliru.
Open chart in a new window
Persegi Bullish
was formed on 12.05 at 16:15:07 (UTC+0)
signal strength 2 of 5
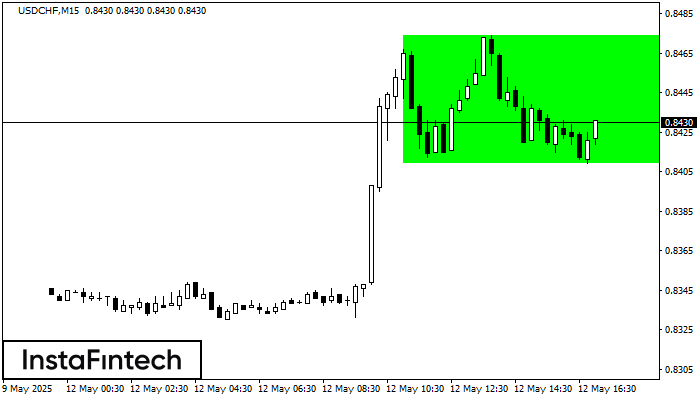
Menurut grafik dari M15, USDCHF terbentuk Persegi Bullish. Pola menunjukkan kelanjutan tren. Batas atas adalah 0.8474, batas lebih rendah adalah 0.8409. Sinyal berarti posisi beli harus dibuka diatas batas atas
Rangka waktu M5 dan M15 mungkin memiliki lebih dari titik entri yang keliru.
Open chart in a new window
Bawah Ganda
was formed on 12.05 at 16:05:36 (UTC+0)
signal strength 1 of 5
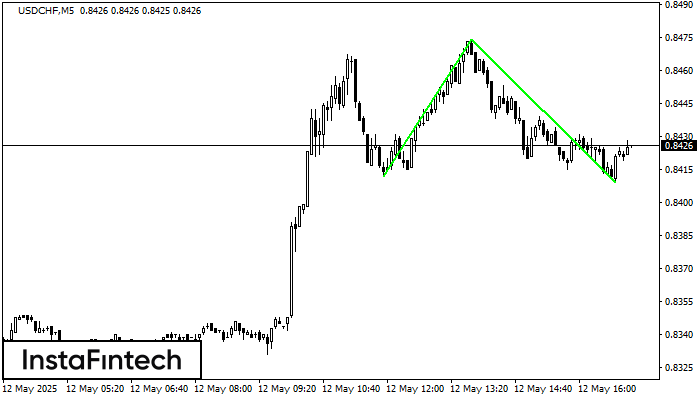
Pola Bawah Ganda telah terbentuk pada USDCHF M5. Formasi ini mensinyalkan reversal tren dari arah penurunan ke arah kenaikan. Sinyal menunjukkan bahwa transaksi beli harus dibuka setelah batas atas pola
Rangka waktu M5 dan M15 mungkin memiliki lebih dari titik entri yang keliru.
Open chart in a new window

