

Pola sebenarnya

Bearish Flag
was formed on 03.04 at 19:27:20 (UTC+0)
signal strength 1 of 5
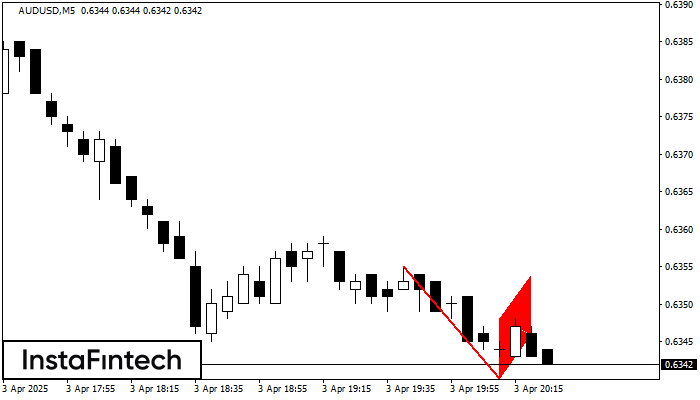
The Bearish Flag pattern has been formed on the chart AUDUSD M5 which signals that the downward trend will continue. If the price breaks below the low at 0.6340, then it is most likely to move further downwards. The price will likely move by the number of points which equals the length of the flag pole (10 points).
The M5 and M15 time frames may have more false entry points.
- All
- All
- Bearish Rectangle
- Bearish Symmetrical Triangle
- Bearish Symmetrical Triangle
- Bullish Rectangle
- Double Top
- Double Top
- Triple Bottom
- Triple Bottom
- Triple Top
- Triple Top
- All
- All
- Buy
- Sale
- All
- 1
- 2
- 3
- 4
- 5
डबल टॉप
was formed on 22.04 at 09:00:07 (UTC+0)
signal strength 4 of 5

डबल टॉप पैटर्न NZDCAD H1 पर बना है। यह संकेत देता है कि प्रवृत्ति ऊपर से नीचे की ओर बदल गई है। संभवतः, यदि 0.8276 पैटर्न का आधार टूट जाता
Open chart in a new window
हेड एण्ड शोल्डर्स
was formed on 22.04 at 08:55:22 (UTC+0)
signal strength 1 of 5

हेड एण्ड शोल्डर्स नामक तकनीकी पैटर्न GOLD M5 के चार्ट पर प्रदर्शित हुआ है। वजनदार कारणों से यह सुझाव दिया जाता है कि दाहिना शोल्डर बनने के बाद कीमत नेकलाइन
M5 और M15 समय सीमा में अधिक फाल्स एंट्री पॉइंट्स हो सकते हैं।
Open chart in a new window
बियरिश सिमेट्रिकल त्रिभुज
was formed on 22.04 at 08:47:25 (UTC+0)
signal strength 1 of 5

M5 के चार्ट के अनुसार, EURNZD से बियरिश सिमेट्रिकल त्रिभुज पैटर्न बना। निचली सीमा 1.9139 भंग होने की स्थिति में यह पैटर्न और नीचे के ट्रेंड की ओर संकेत करता
M5 और M15 समय सीमा में अधिक फाल्स एंट्री पॉइंट्स हो सकते हैं।
Open chart in a new window


