

Pola sebenarnya

Double Top
was formed on 03.04 at 17:09:44 (UTC+0)
signal strength 1 of 5
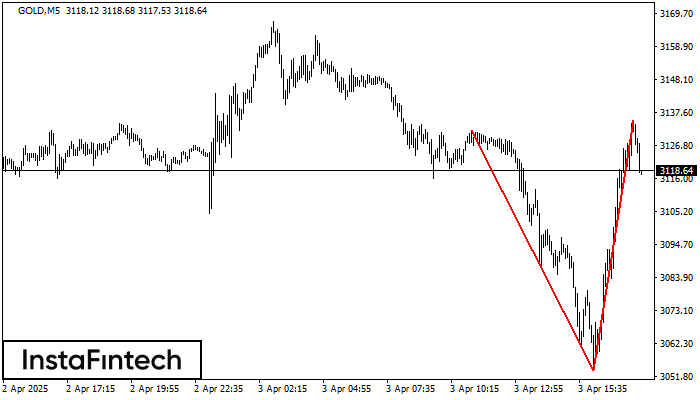
On the chart of GOLD M5 the Double Top reversal pattern has been formed. Characteristics: the upper boundary 3135.06; the lower boundary 3053.74; the width of the pattern 8132 points. The signal: a break of the lower boundary will cause continuation of the downward trend targeting the 3053.59 level.
The M5 and M15 time frames may have more false entry points.
- All
- All
- Bearish Rectangle
- Bearish Symmetrical Triangle
- Bearish Symmetrical Triangle
- Bullish Rectangle
- Double Top
- Double Top
- Triple Bottom
- Triple Bottom
- Triple Top
- Triple Top
- All
- All
- Buy
- Sale
- All
- 1
- 2
- 3
- 4
- 5
Bendera Bearish
was formed on 16.05 at 05:10:45 (UTC+0)
signal strength 1 of 5
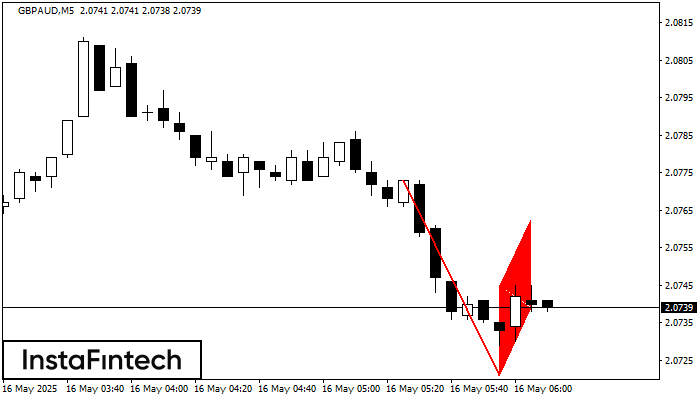
Pola Bendera Bearish telah terbentuk di grafik GBPAUD M5, yang memberikan sinyal tren menurun akan berlanjut. Jika harga menembus ke bawah titik terendah di 2.0721, maka kemungkinan besar harga akan
Rangka waktu M5 dan M15 mungkin memiliki lebih dari titik entri yang keliru.
Open chart in a new window
Panji Bearish
was formed on 16.05 at 05:10:39 (UTC+0)
signal strength 1 of 5
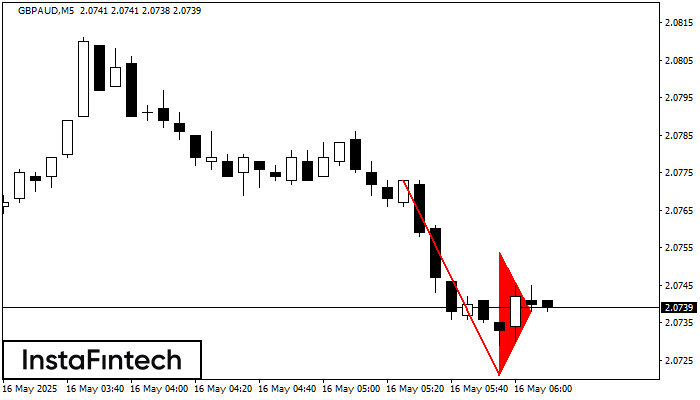
Pola Panji Bearish telah terbentuk di grafik GBPAUD M5. Pola ini memberikan sinyal potensi kelanjutan tren yang ada. Spesifikasi: titik terendah pola berkoordinat di 2.0721; proyeksi titik tertinggi sama dengan
Rangka waktu M5 dan M15 mungkin memiliki lebih dari titik entri yang keliru.
Open chart in a new window
Persegi Bullish
was formed on 16.05 at 04:52:53 (UTC+0)
signal strength 1 of 5
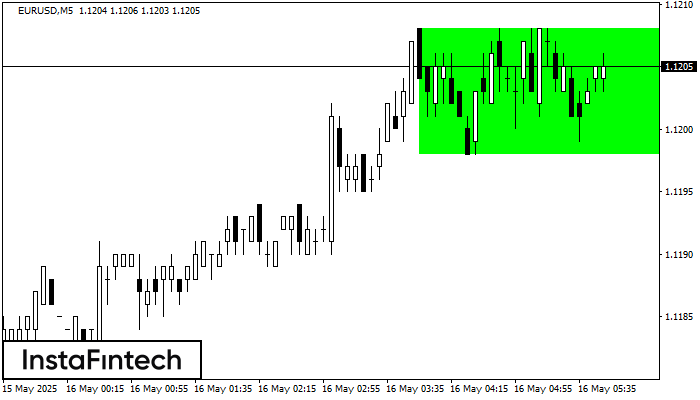
Menurut grafik dari M5, EURUSD terbentuk Persegi Bullish yang merupakan pola dari kelanjutan tren. Pola terkandung dalam batas berikut: batas yang lebih rendah 1.1198 – 1.1198 dan batas atas 1.1208
Rangka waktu M5 dan M15 mungkin memiliki lebih dari titik entri yang keliru.
Open chart in a new window


