

Pola sebenarnya

Bullish Symmetrical Triangle
was formed on 03.04 at 16:53:41 (UTC+0)
signal strength 2 of 5
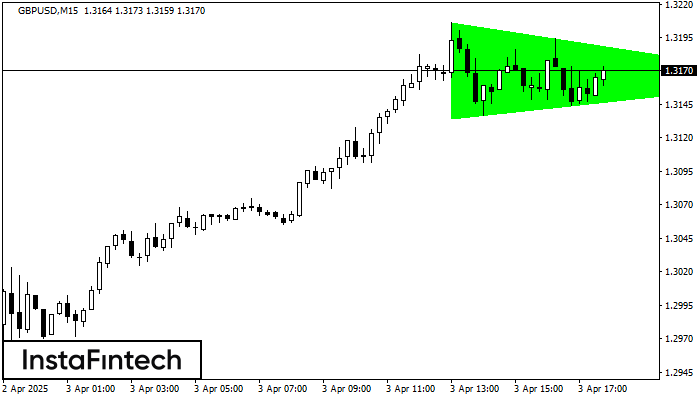
According to the chart of M15, GBPUSD formed the Bullish Symmetrical Triangle pattern. The lower border of the pattern touches the coordinates 1.3134/1.3164 whereas the upper border goes across 1.3206/1.3164. If the Bullish Symmetrical Triangle pattern is in progress, this evidently signals a further upward trend. In other words, in case the scenario comes true, the price of GBPUSD will breach the upper border to head for 1.3187.
The M5 and M15 time frames may have more false entry points.
- All
- All
- Bearish Rectangle
- Bearish Symmetrical Triangle
- Bearish Symmetrical Triangle
- Bullish Rectangle
- Double Top
- Double Top
- Triple Bottom
- Triple Bottom
- Triple Top
- Triple Top
- All
- All
- Buy
- Sale
- All
- 1
- 2
- 3
- 4
- 5
Triple Bottom
was formed on 22.05 at 20:50:14 (UTC+0)
signal strength 1 of 5
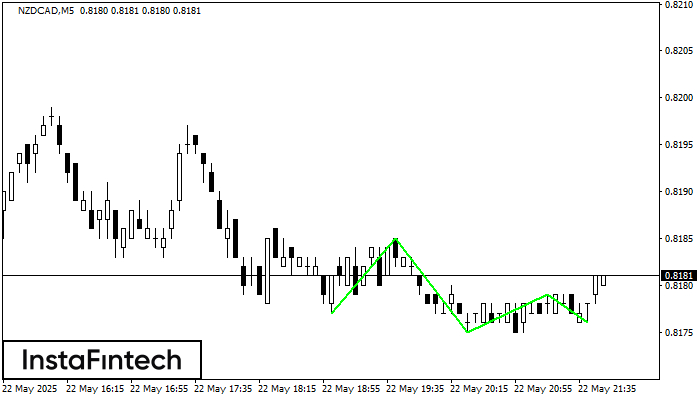
The Triple Bottom pattern has formed on the chart of NZDCAD M5. Features of the pattern: The lower line of the pattern has coordinates 0.8185 with the upper limit 0.8185/0.8179
The M5 and M15 time frames may have more false entry points.
Open chart in a new window
Bearish pennant
was formed on 22.05 at 20:40:59 (UTC+0)
signal strength 4 of 5
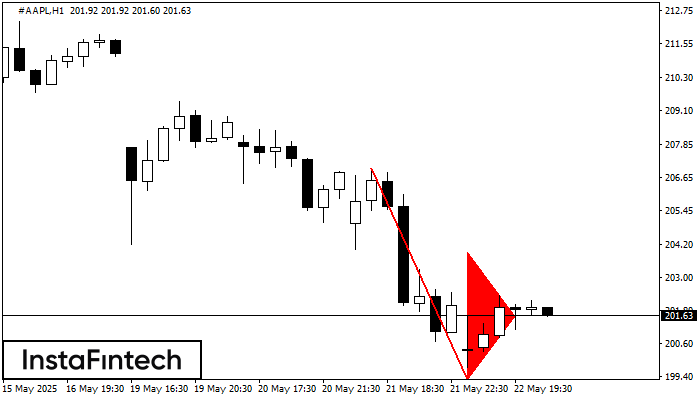
The Bearish pennant pattern has formed on the #AAPL H1 chart. It signals potential continuation of the existing trend. Specifications: the pattern’s bottom has the coordinate of 199.24; the projection
Open chart in a new window
Bearish pennant
was formed on 22.05 at 20:40:35 (UTC+0)
signal strength 4 of 5
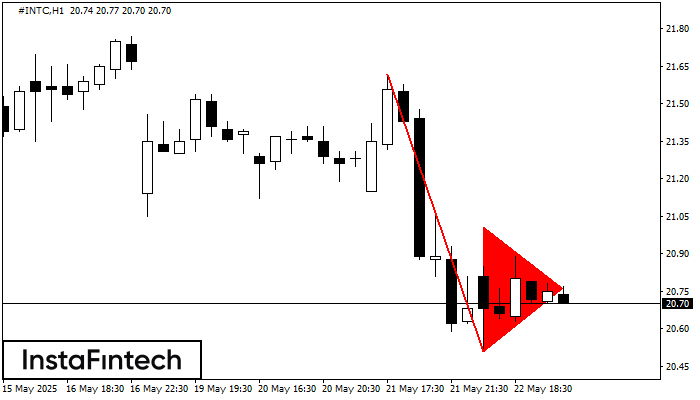
The Bearish pennant pattern has formed on the #INTC H1 chart. It signals potential continuation of the existing trend. Specifications: the pattern’s bottom has the coordinate of 20.51; the projection
Open chart in a new window


