

Pola sebenarnya

Bullish Symmetrical Triangle
was formed on 03.04 at 14:45:24 (UTC+0)
signal strength 1 of 5
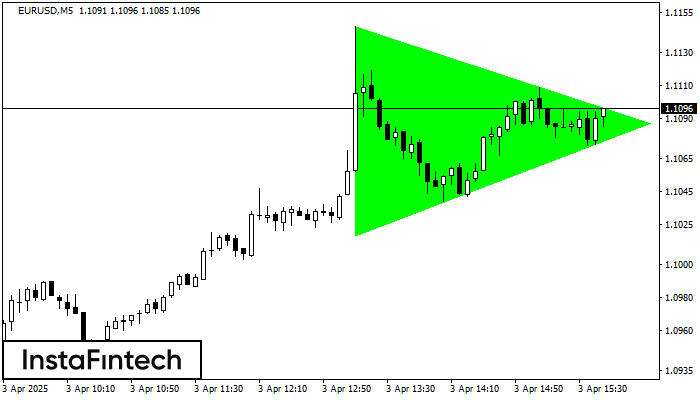
According to the chart of M5, EURUSD formed the Bullish Symmetrical Triangle pattern. Description: This is the pattern of a trend continuation. 1.1146 and 1.1018 are the coordinates of the upper and lower borders respectively. The pattern width is measured on the chart at 128 pips. Outlook: If the upper border 1.1146 is broken, the price is likely to continue its move by 1.1102.
The M5 and M15 time frames may have more false entry points.
Lihat juga
- All
- All
- Bearish Rectangle
- Bearish Symmetrical Triangle
- Bearish Symmetrical Triangle
- Bullish Rectangle
- Double Top
- Double Top
- Triple Bottom
- Triple Bottom
- Triple Top
- Triple Top
- All
- All
- Buy
- Sale
- All
- 1
- 2
- 3
- 4
- 5
Bawah Ganda
was formed on 22.04 at 14:06:13 (UTC+0)
signal strength 1 of 5

Pola Bawah Ganda telah terbentuk pada NZDCHF M5; batas atas di 0.4874; batas bawah di 0.4857. Lebar pola sebesar 17 poin. Jika harga menembus batas atas 0.4874, Perubahan dalam tren
Rangka waktu M5 dan M15 mungkin memiliki lebih dari titik entri yang keliru.
Open chart in a new window
Bawah Ganda
was formed on 22.04 at 13:40:19 (UTC+0)
signal strength 1 of 5

Pola Bawah Ganda telah terbentuk pada GBPJPY M5. Karakteristik: level support 187.44; level resistance 187.65; lebar pola 21 poin. Jika level resistance ditembus, perubahan dalam tren dapat diprediksi dengan target
Rangka waktu M5 dan M15 mungkin memiliki lebih dari titik entri yang keliru.
Open chart in a new window
Bawah Ganda
was formed on 22.04 at 12:20:21 (UTC+0)
signal strength 1 of 5

Pola Bawah Ganda telah terbentuk pada AUDCHF M5. Formasi ini mensinyalkan reversal tren dari arah penurunan ke arah kenaikan. Sinyal menunjukkan bahwa transaksi beli harus dibuka setelah batas atas pola
Rangka waktu M5 dan M15 mungkin memiliki lebih dari titik entri yang keliru.
Open chart in a new window


