

Pola sebenarnya

Double Bottom
was formed on 02.04 at 10:15:42 (UTC+0)
signal strength 2 of 5
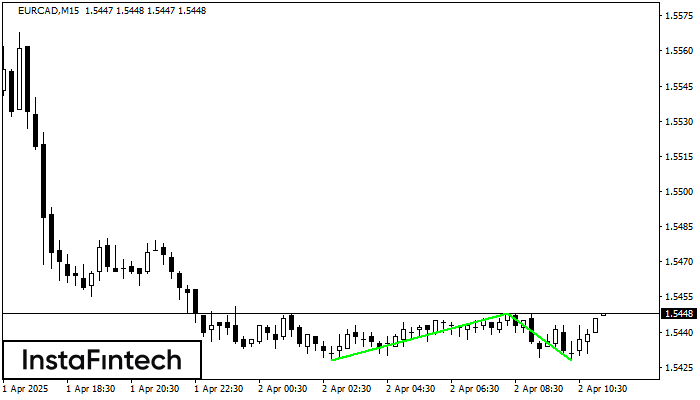
The Double Bottom pattern has been formed on EURCAD M15. This formation signals a reversal of the trend from downwards to upwards. The signal is that a buy trade should be opened after the upper boundary of the pattern 1.5448 is broken. The further movements will rely on the width of the current pattern 20 points.
The M5 and M15 time frames may have more false entry points.
- All
- All
- Bearish Rectangle
- Bearish Symmetrical Triangle
- Bearish Symmetrical Triangle
- Bullish Rectangle
- Double Top
- Double Top
- Triple Bottom
- Triple Bottom
- Triple Top
- Triple Top
- All
- All
- Buy
- Sale
- All
- 1
- 2
- 3
- 4
- 5
Bawah Ganda
was formed on 19.05 at 15:44:51 (UTC+0)
signal strength 2 of 5
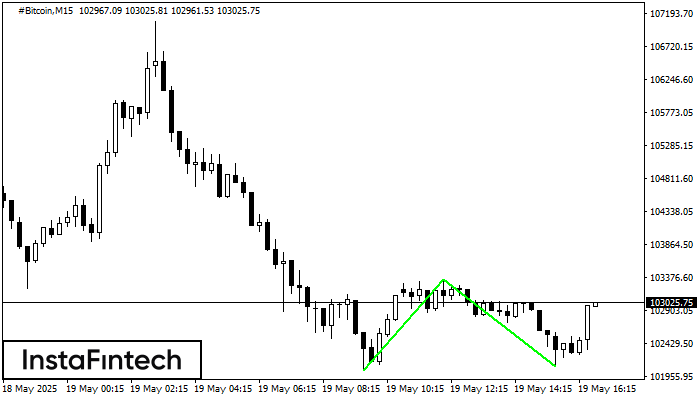
Pola Bawah Ganda telah terbentuk pada #Bitcoin M15; batas atas di 103355.86; batas bawah di 102090.12. Lebar pola sebesar 131679 poin. Jika harga menembus batas atas 103355.86, Perubahan dalam tren
Rangka waktu M5 dan M15 mungkin memiliki lebih dari titik entri yang keliru.
Open chart in a new window
Bawah Ganda
was formed on 19.05 at 15:39:46 (UTC+0)
signal strength 1 of 5
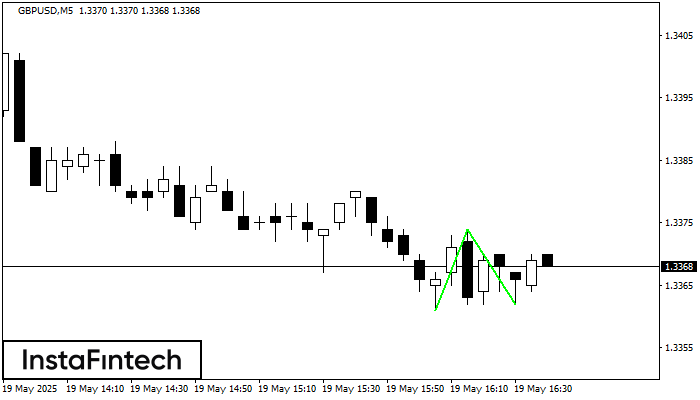
Pola Bawah Ganda telah terbentuk pada GBPUSD M5. Formasi ini mensinyalkan reversal tren dari arah penurunan ke arah kenaikan. Sinyal menunjukkan bahwa transaksi beli harus dibuka setelah batas atas pola
Rangka waktu M5 dan M15 mungkin memiliki lebih dari titik entri yang keliru.
Open chart in a new window
Persegi Bullish
was formed on 19.05 at 15:00:41 (UTC+0)
signal strength 2 of 5
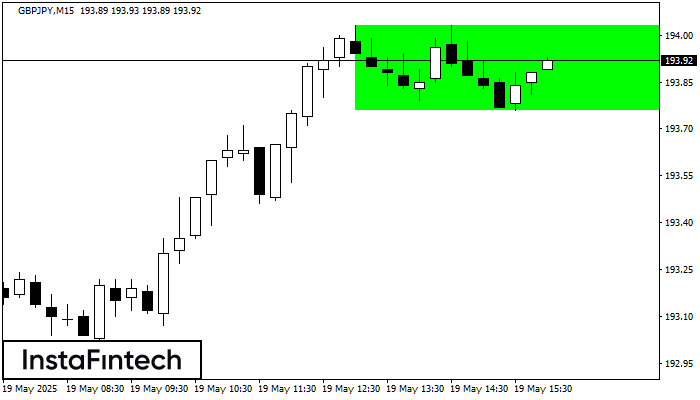
Menurut grafik dari M15, GBPJPY terbentuk Persegi Bullish yang merupakan pola dari kelanjutan tren. Pola terkandung dalam batas berikut: batas yang lebih rendah 193.76 – 193.76 dan batas atas 194.03
Rangka waktu M5 dan M15 mungkin memiliki lebih dari titik entri yang keliru.
Open chart in a new window


