

Pola sebenarnya

Bullish Rectangle
was formed on 01.04 at 20:57:49 (UTC+0)
signal strength 1 of 5
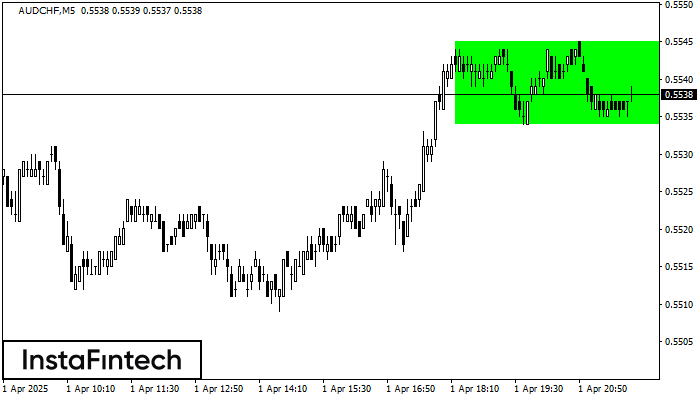
According to the chart of M5, AUDCHF formed the Bullish Rectangle which is a pattern of a trend continuation. The pattern is contained within the following borders: the lower border 0.5534 – 0.5534 and upper border 0.5545 – 0.5545. In case the upper border is broken, the instrument is likely to follow the upward trend.
The M5 and M15 time frames may have more false entry points.
- All
- All
- Bearish Rectangle
- Bearish Symmetrical Triangle
- Bearish Symmetrical Triangle
- Bullish Rectangle
- Double Top
- Double Top
- Triple Bottom
- Triple Bottom
- Triple Top
- Triple Top
- All
- All
- Buy
- Sale
- All
- 1
- 2
- 3
- 4
- 5
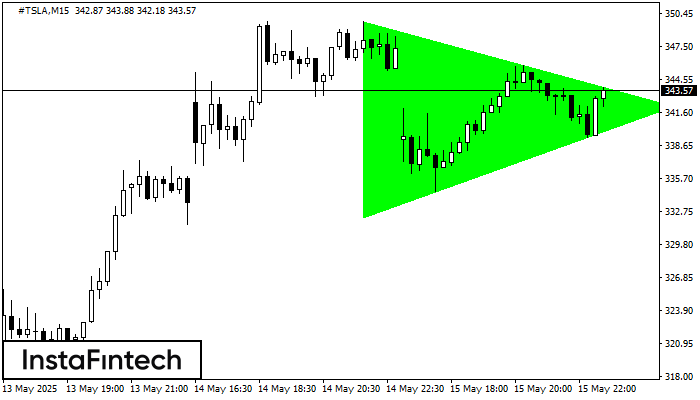
Segitiga Simetris Bullish
was formed on 15.05 at 21:50:18 (UTC+0)
signal strength 2 of 5

Menurut Grafik dari M15, #TSLA dibentuk pola Segitiga Simetris Bullish. Batas yang lebih rendah dari pola menyentuh kordinat 332.24/342.17 dimana batas atas berada sepanjang 349.71/342.17. Jika pola Segitiga Simetris Bullish
Rangka waktu M5 dan M15 mungkin memiliki lebih dari titik entri yang keliru.
Open chart in a new window
Segitiga Simetris Bullish
was formed on 15.05 at 21:50:15 (UTC+0)
signal strength 2 of 5
Menurut Grafik dari M15, #TSLA dibentuk pola Segitiga Simetris Bullish. Batas yang lebih rendah dari pola menyentuh kordinat 332.24/342.17 dimana batas atas berada sepanjang 349.71/342.17. Jika pola Segitiga Simetris Bullish
Rangka waktu M5 dan M15 mungkin memiliki lebih dari titik entri yang keliru.
Open chart in a new window
Bawah Ganda
was formed on 15.05 at 21:25:32 (UTC+0)
signal strength 1 of 5
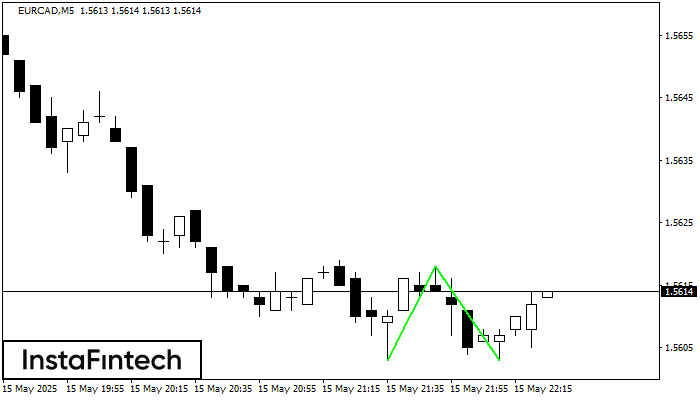
Pola Bawah Ganda telah terbentuk pada EURCAD M5; batas atas di 1.5618; batas bawah di 1.5603. Lebar pola sebesar 15 poin. Jika harga menembus batas atas 1.5618, Perubahan dalam tren
Rangka waktu M5 dan M15 mungkin memiliki lebih dari titik entri yang keliru.
Open chart in a new window


