

Pola sebenarnya

Inverse Head and Shoulder
was formed on 01.04 at 20:15:50 (UTC+0)
signal strength 2 of 5
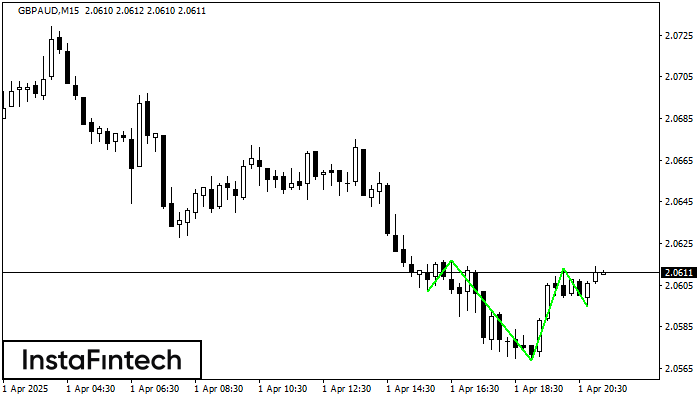
According to the chart of M15, GBPAUD formed the Inverse Head and Shoulder pattern. The Head’s top is set at 2.0613 while the median line of the Neck is found at 2.0569/2.0595. The formation of the Inverse Head and Shoulder pattern evidently signals a reversal of the downward trend. In other words, in case the scenario comes true, the price of GBPAUD will go towards 2.0635
The M5 and M15 time frames may have more false entry points.
Lihat juga
- All
- All
- Bearish Rectangle
- Bearish Symmetrical Triangle
- Bearish Symmetrical Triangle
- Bullish Rectangle
- Double Top
- Double Top
- Triple Bottom
- Triple Bottom
- Triple Top
- Triple Top
- All
- All
- Buy
- Sale
- All
- 1
- 2
- 3
- 4
- 5
Retângulo de alta
was formed on 11.04 at 22:20:31 (UTC+0)
signal strength 1 of 5

De acordo com o gráfico de M5, NZDCHF formou Retângulo de alta. O padrão indica uma continuação da tendência. O limite superior é 0.4754, o limite inferior é 0.4746
Os intervalos M5 e M15 podem ter mais pontos de entrada falsos.
Open chart in a new window
Retângulo de baixa
was formed on 11.04 at 22:10:27 (UTC+0)
signal strength 1 of 5

De acordo com o gráfico de M5, USDCAD formou Retângulo de baixa que é um padrão de uma continuação de tendência. O padrão está dentro dos seguintes limites: limite inferior
Os intervalos M5 e M15 podem ter mais pontos de entrada falsos.
Open chart in a new window
Topo duplo
was formed on 11.04 at 22:10:22 (UTC+0)
signal strength 1 of 5

No gráfico de #Bitcoin M5 o padrão de reversão Topo duplo foi formado. Características: o limite superior 83924.61; o limite inferior 83599.60; a largura do padrão 32501 pontos. O sinal
Os intervalos M5 e M15 podem ter mais pontos de entrada falsos.
Open chart in a new window


