

Pola sebenarnya

Double Top
was formed on 31.03 at 18:31:19 (UTC+0)
signal strength 1 of 5
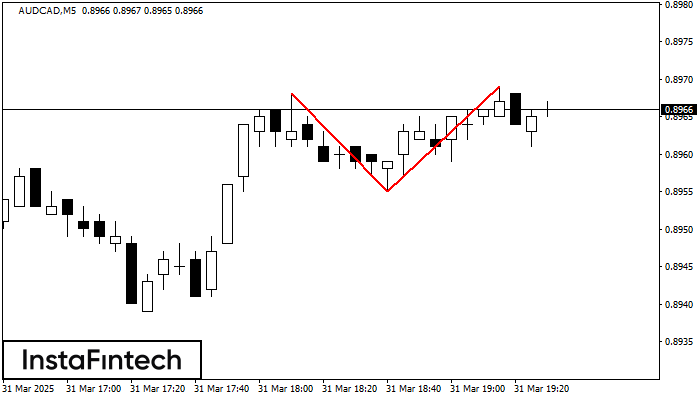
The Double Top reversal pattern has been formed on AUDCAD M5. Characteristics: the upper boundary 0.8968; the lower boundary 0.8955; the width of the pattern is 14 points. Sell trades are better to be opened below the lower boundary 0.8955 with a possible movements towards the 0.8940 level.
The M5 and M15 time frames may have more false entry points.
- All
- All
- Bearish Rectangle
- Bearish Symmetrical Triangle
- Bearish Symmetrical Triangle
- Bullish Rectangle
- Double Top
- Double Top
- Triple Bottom
- Triple Bottom
- Triple Top
- Triple Top
- All
- All
- Buy
- Sale
- All
- 1
- 2
- 3
- 4
- 5
Persegi Bullish
was formed on 12.05 at 17:30:19 (UTC+0)
signal strength 1 of 5
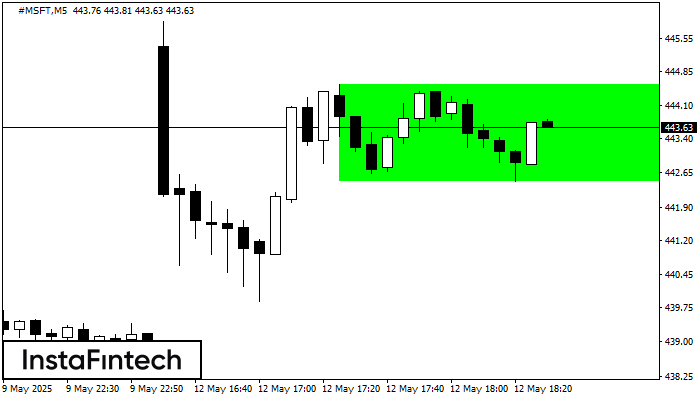
Menurut grafik dari M5, #MSFT terbentuk Persegi Bullish. Pola menunjukkan kelanjutan tren. Batas atas adalah 444.56, batas lebih rendah adalah 442.46. Sinyal berarti posisi beli harus dibuka diatas batas atas
Rangka waktu M5 dan M15 mungkin memiliki lebih dari titik entri yang keliru.
Open chart in a new window
Bendera Bullish
was formed on 12.05 at 17:30:16 (UTC+0)
signal strength 1 of 5
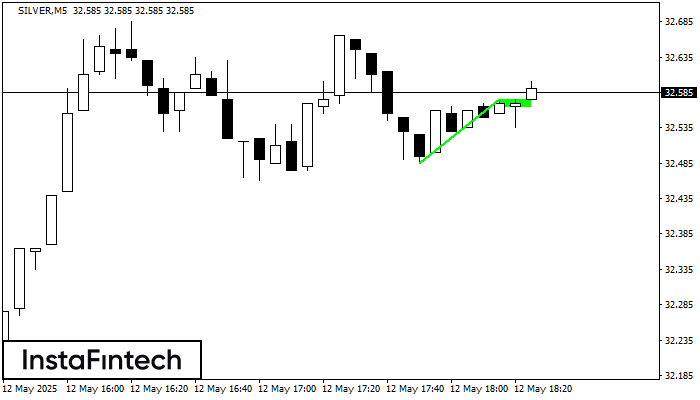
Pola Bendera Bullish telah terbentuk di grafik SILVER M5, yang memberikan sinyal tren naik akan berlanjut. Sinyal: penembusan titik puncak di 32.58 mungkin mendorong harga lebih tinggi, dan kenaikan akan
Rangka waktu M5 dan M15 mungkin memiliki lebih dari titik entri yang keliru.
Open chart in a new window
Persegi Bullish
was formed on 12.05 at 17:26:44 (UTC+0)
signal strength 1 of 5
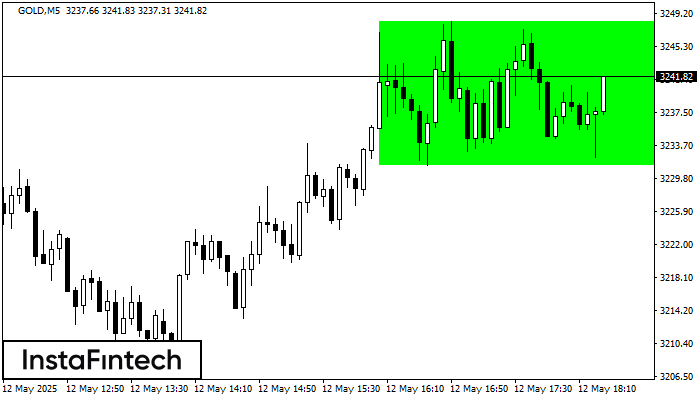
Menurut grafik dari M5, GOLD terbentuk Persegi Bullish yang merupakan pola dari kelanjutan tren. Pola terkandung dalam batas berikut: batas yang lebih rendah 3231.35 – 3231.35 dan batas atas 3248.23
Rangka waktu M5 dan M15 mungkin memiliki lebih dari titik entri yang keliru.
Open chart in a new window

