

Pola sebenarnya

Bearish pennant
was formed on 31.03 at 16:30:30 (UTC+0)
signal strength 2 of 5
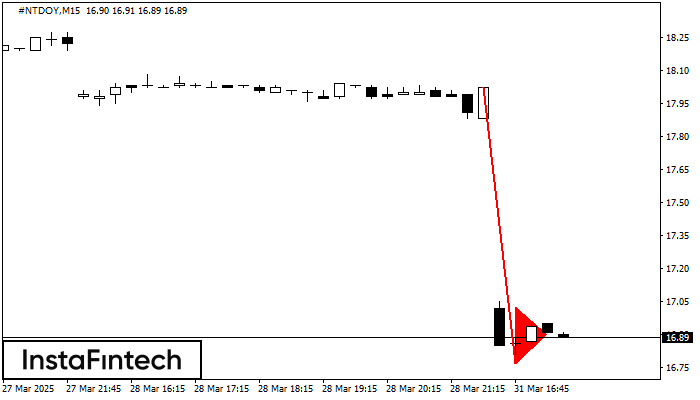
The Bearish pennant pattern has formed on the #NTDOY M15 chart. This pattern type is characterized by a slight slowdown after which the price will move in the direction of the original trend. In case the price fixes below the pattern’s low of 16.77, a trader will be able to successfully enter the sell position.
The M5 and M15 time frames may have more false entry points.
Lihat juga
- All
- All
- Bearish Rectangle
- Bearish Symmetrical Triangle
- Bearish Symmetrical Triangle
- Bullish Rectangle
- Double Top
- Double Top
- Triple Bottom
- Triple Bottom
- Triple Top
- Triple Top
- All
- All
- Buy
- Sale
- All
- 1
- 2
- 3
- 4
- 5
Bearish Rectangle
was formed on 12.05 at 19:21:26 (UTC+0)
signal strength 1 of 5
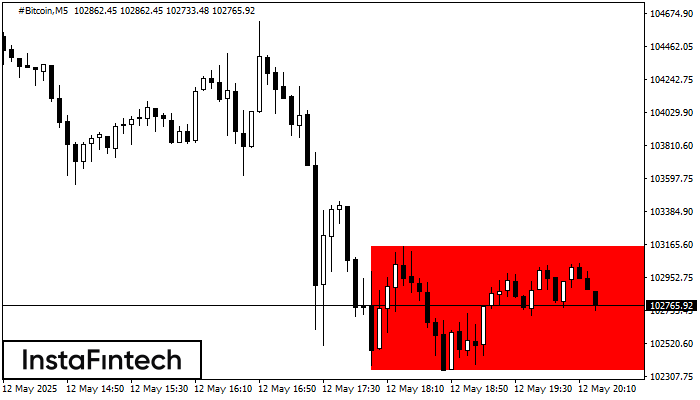
According to the chart of M5, #Bitcoin formed the Bearish Rectangle. The pattern indicates a trend continuation. The upper border is 103156.34, the lower border is 102345.35. The signal means
The M5 and M15 time frames may have more false entry points.
Open chart in a new window
Double Top
was formed on 12.05 at 19:05:36 (UTC+0)
signal strength 1 of 5
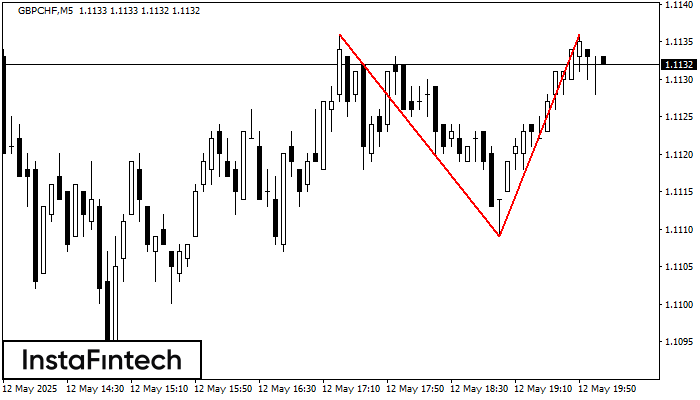
On the chart of GBPCHF M5 the Double Top reversal pattern has been formed. Characteristics: the upper boundary 1.1136; the lower boundary 1.1109; the width of the pattern 27 points
The M5 and M15 time frames may have more false entry points.
Open chart in a new window
Bullish Symmetrical Triangle
was formed on 12.05 at 18:32:08 (UTC+0)
signal strength 2 of 5
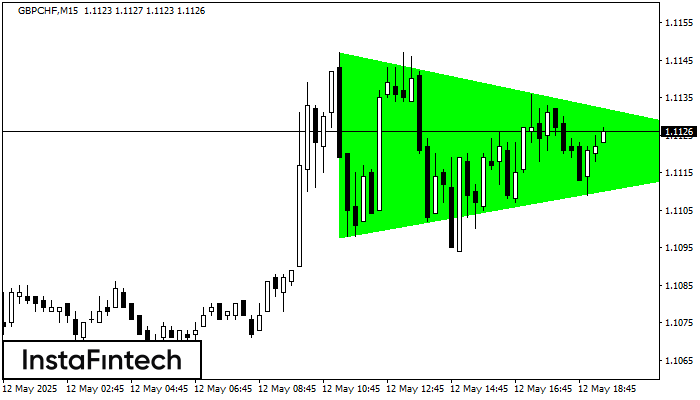
According to the chart of M15, GBPCHF formed the Bullish Symmetrical Triangle pattern, which signals the trend will continue. Description. The upper border of the pattern touches the coordinates 1.1147/1.1120
The M5 and M15 time frames may have more false entry points.
Open chart in a new window


