

Pola sebenarnya

Bearish pennant
was formed on 31.03 at 15:25:29 (UTC+0)
signal strength 2 of 5

The Bearish pennant pattern has formed on the #AAPL M15 chart. It signals potential continuation of the existing trend. Specifications: the pattern’s bottom has the coordinate of 216.06; the projection of the flagpole height is equal to 323 pips. In case the price breaks out the pattern’s bottom of 216.06, the downtrend is expected to continue for further level 215.84.
The M5 and M15 time frames may have more false entry points.
- All
- All
- Bearish Rectangle
- Bearish Symmetrical Triangle
- Bearish Symmetrical Triangle
- Bullish Rectangle
- Double Top
- Double Top
- Triple Bottom
- Triple Bottom
- Triple Top
- Triple Top
- All
- All
- Buy
- Sale
- All
- 1
- 2
- 3
- 4
- 5
Persegi Bullish
was formed on 23.04 at 17:45:08 (UTC+0)
signal strength 1 of 5
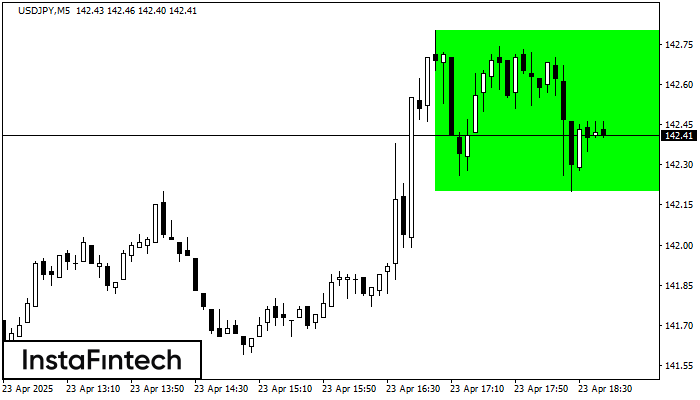
Menurut grafik dari M5, USDJPY terbentuk Persegi Bullish yang merupakan pola dari kelanjutan tren. Pola terkandung dalam batas berikut: batas yang lebih rendah 142.20 – 142.20 dan batas atas 142.80
Rangka waktu M5 dan M15 mungkin memiliki lebih dari titik entri yang keliru.
Open chart in a new window
Teratas Triple
was formed on 23.04 at 17:30:02 (UTC+0)
signal strength 2 of 5
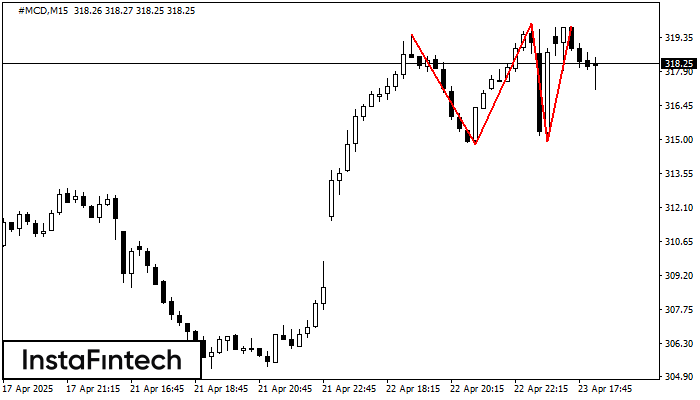
Pola Teratas Triple telah terbentuk pada grafik instrumen trading #MCD M15. Pola tersebut merupakan pola reversal menampilkan karakteristik berikut: level resistance -33, levek support -14, dan lebar pola 469. Prakiraan
Rangka waktu M5 dan M15 mungkin memiliki lebih dari titik entri yang keliru.
Open chart in a new window
Teratas Triple
was formed on 23.04 at 17:24:36 (UTC+0)
signal strength 1 of 5
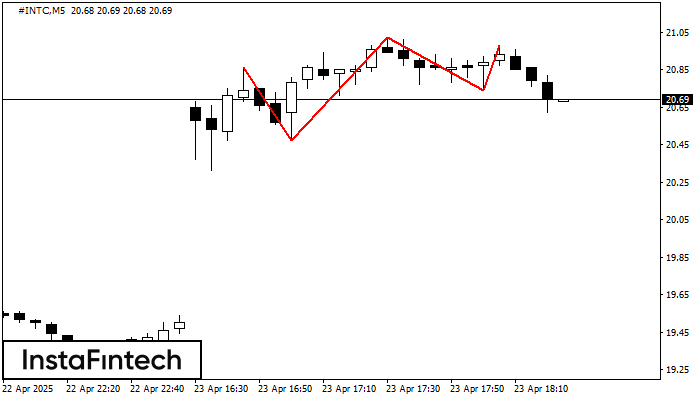
Pola Teratas Triple telah terbentuk pada grafik instrumen trading #INTC M5. Pola tersebut merupakan pola reversal menampilkan karakteristik berikut: level resistance -12, levek support -27, dan lebar pola 39. Prakiraan
Rangka waktu M5 dan M15 mungkin memiliki lebih dari titik entri yang keliru.
Open chart in a new window


