

Pola sebenarnya

Bullish Rectangle
was formed on 31.03 at 14:32:37 (UTC+0)
signal strength 1 of 5

According to the chart of M5, #Bitcoin formed the Bullish Rectangle which is a pattern of a trend continuation. The pattern is contained within the following borders: the lower border 81857.61 – 81857.61 and upper border 82250.14 – 82250.14. In case the upper border is broken, the instrument is likely to follow the upward trend.
The M5 and M15 time frames may have more false entry points.
- All
- All
- Bearish Rectangle
- Bearish Symmetrical Triangle
- Bearish Symmetrical Triangle
- Bullish Rectangle
- Double Top
- Double Top
- Triple Bottom
- Triple Bottom
- Triple Top
- Triple Top
- All
- All
- Buy
- Sale
- All
- 1
- 2
- 3
- 4
- 5
Kepala dan Bahu Terbalik
was formed on 09.05 at 10:00:01 (UTC+0)
signal strength 3 of 5
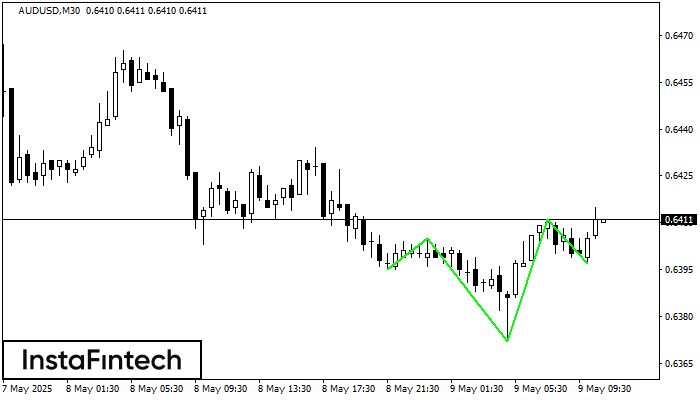
Menurut M30, AUDUSD membentuk pola teknikal – Kepala dan Bahu Terbalik. Jika garis leher (Neckline) 0.6405/0.6411 ditembus, maka instrumen ini kemungkinan akan bergerak menuju 0.6441
Open chart in a new window
Kepala dan Bahu Terbalik
was formed on 09.05 at 09:45:18 (UTC+0)
signal strength 2 of 5
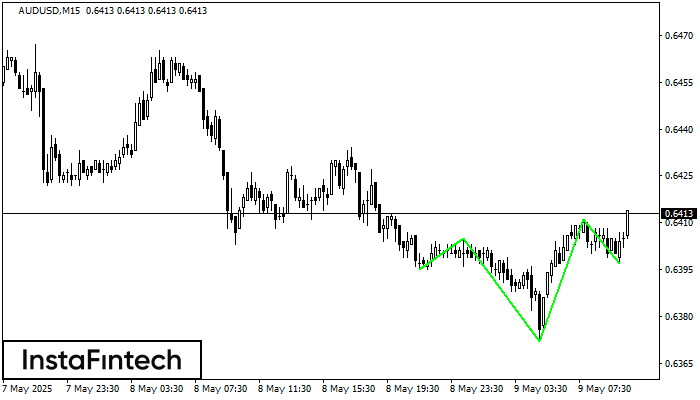
Menurut M15, AUDUSD membentuk pola teknikal – Kepala dan Bahu Terbalik. Jika garis leher (Neckline) 0.6405/0.6411 ditembus, maka instrumen ini kemungkinan akan bergerak menuju 0.6434
Rangka waktu M5 dan M15 mungkin memiliki lebih dari titik entri yang keliru.
Open chart in a new window
Segitiga Simetris Bullish
was formed on 09.05 at 09:45:12 (UTC+0)
signal strength 2 of 5
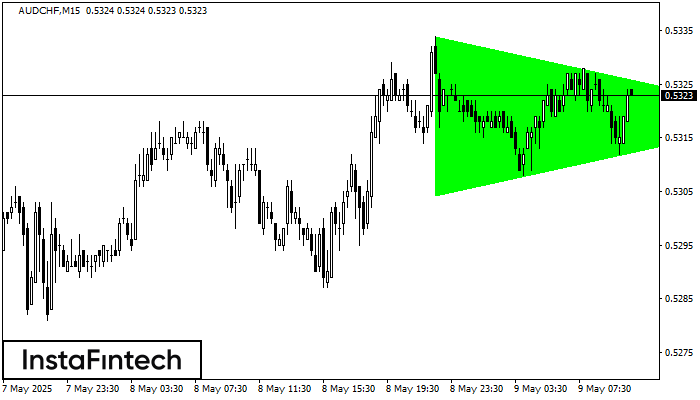
Menurut Grafik dari M15, AUDCHF dibentuk pola Segitiga Simetris Bullish. Deskripsi: Ini merupakan pola dari kelanjutan tren. 0.5334 dan 0.5304 adalah kordinat masing-masing dari batas atas dan lebih rendah. Lebar
Rangka waktu M5 dan M15 mungkin memiliki lebih dari titik entri yang keliru.
Open chart in a new window


