

Pola sebenarnya

Triple Top
was formed on 31.03 at 13:10:27 (UTC+0)
signal strength 1 of 5
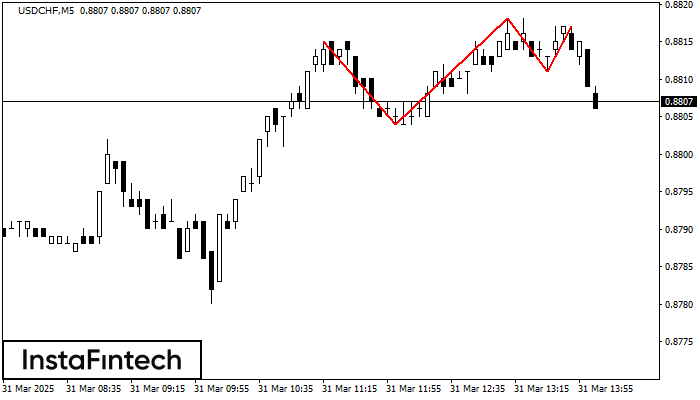
On the chart of the USDCHF M5 trading instrument, the Triple Top pattern that signals a trend change has formed. It is possible that after formation of the third peak, the price will try to break through the resistance level 0.8804, where we advise to open a trading position for sale. Take profit is the projection of the pattern’s width, which is 11 points.
The M5 and M15 time frames may have more false entry points.
Lihat juga
- All
- All
- Bearish Rectangle
- Bearish Symmetrical Triangle
- Bearish Symmetrical Triangle
- Bullish Rectangle
- Double Top
- Double Top
- Triple Bottom
- Triple Bottom
- Triple Top
- Triple Top
- All
- All
- Buy
- Sale
- All
- 1
- 2
- 3
- 4
- 5
Persegi Bullish
was formed on 22.04 at 17:40:16 (UTC+0)
signal strength 1 of 5
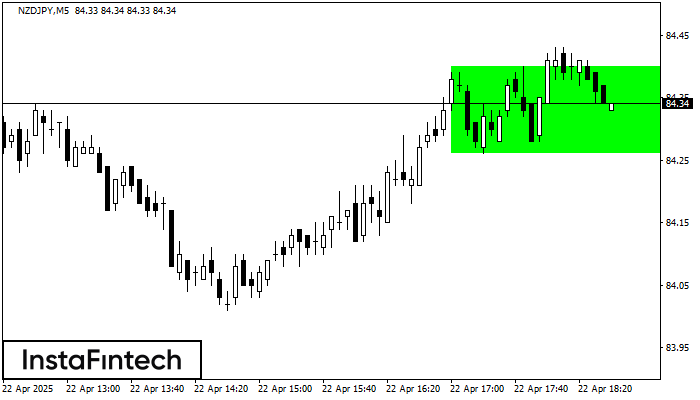
Menurut grafik dari M5, NZDJPY terbentuk Persegi Bullish. Jenis pola ini menunjukkan kelanjutan tren. Terdiri dari dua tingkat: resistance 84.40 dan support 84.26. Jika level resistance 84.40 - 84.40 ditembus
Rangka waktu M5 dan M15 mungkin memiliki lebih dari titik entri yang keliru.
Open chart in a new window
Segitiga Simetris Bearish
was formed on 22.04 at 17:31:26 (UTC+0)
signal strength 1 of 5
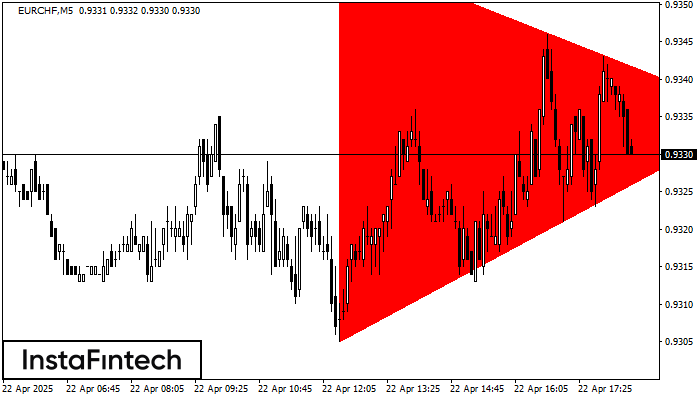
Menurut Grafik dari M5, EURCHF dibentuk pola Segitiga Simetris Bearish. Rekomendasi Trading: Penembusan dari batas yang lebih rendah 0.9305 kemungkinan akan mendorong kelanjutan dari tren penurunan
Rangka waktu M5 dan M15 mungkin memiliki lebih dari titik entri yang keliru.
Open chart in a new window
Segitiga Simetris Bearish
was formed on 22.04 at 17:30:13 (UTC+0)
signal strength 1 of 5
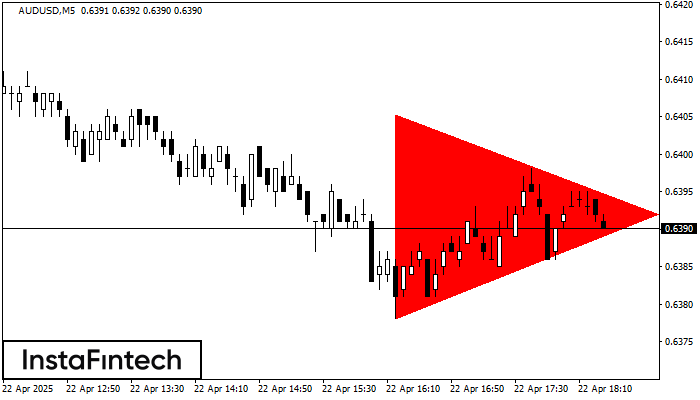
Menurut Grafik dari M5, AUDUSD dibentuk pola Segitiga Simetris Bearish. Deskripsi: Batas yang lebih rendah adalah 0.6378/0.6392 dan batas atas adalah 0.6405/0.6392. Lebar pola diukur dalam grafik di -27 pips
Rangka waktu M5 dan M15 mungkin memiliki lebih dari titik entri yang keliru.
Open chart in a new window


