

Pola sebenarnya

Double Bottom
was formed on 31.03 at 05:35:10 (UTC+0)
signal strength 1 of 5

The Double Bottom pattern has been formed on USDJPY M5. Characteristics: the support level 148.74; the resistance level 148.96; the width of the pattern 22 points. If the resistance level is broken, a change in the trend can be predicted with the first target point lying at the distance of 21 points.
The M5 and M15 time frames may have more false entry points.
Lihat juga
- All
- All
- Bearish Rectangle
- Bearish Symmetrical Triangle
- Bearish Symmetrical Triangle
- Bullish Rectangle
- Double Top
- Double Top
- Triple Bottom
- Triple Bottom
- Triple Top
- Triple Top
- All
- All
- Buy
- Sale
- All
- 1
- 2
- 3
- 4
- 5
Triple Bottom
сформирован 15.04 в 20:55:29 (UTC+0)
сила сигнала 1 из 5
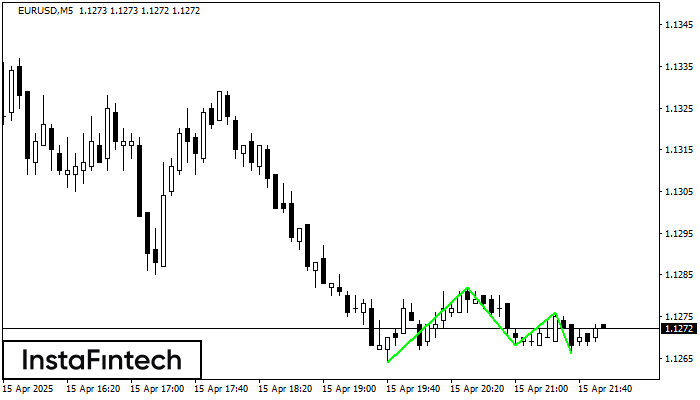
The Triple Bottom pattern has formed on the chart of EURUSD M5. Features of the pattern: The lower line of the pattern has coordinates 1.1282 with the upper limit 1.1282/1.1276
The M5 and M15 time frames may have more false entry points.
Открыть график инструмента в новом окне
Triple Bottom
сформирован 15.04 в 20:50:28 (UTC+0)
сила сигнала 1 из 5
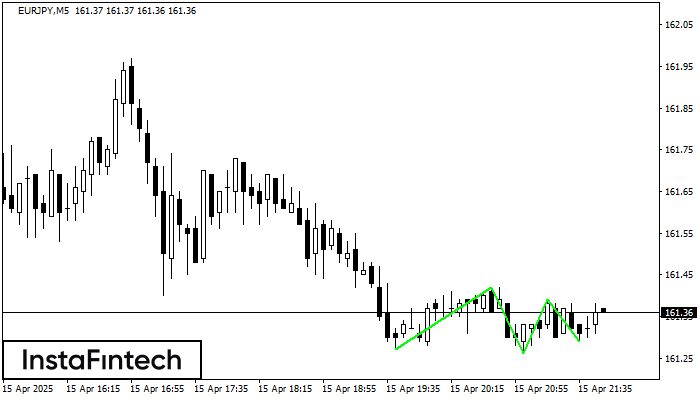
The Triple Bottom pattern has been formed on EURJPY M5. It has the following characteristics: resistance level 161.42/161.39; support level 161.27/161.29; the width is 15 points. In the event
The M5 and M15 time frames may have more false entry points.
Открыть график инструмента в новом окне
Bullish pennant
сформирован 15.04 в 20:46:24 (UTC+0)
сила сигнала 3 из 5
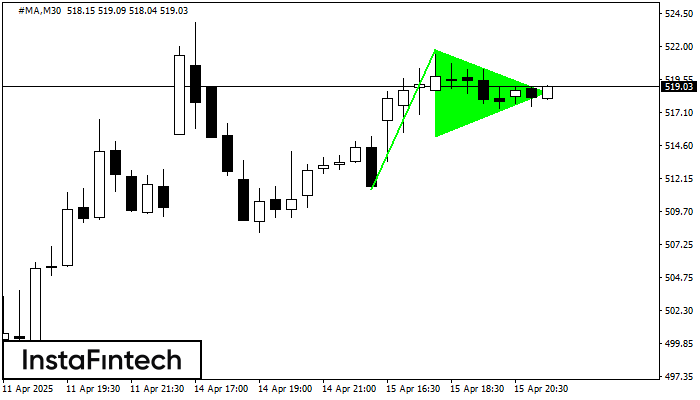
The Bullish pennant signal – Trading instrument #MA M30, continuation pattern. Forecast: it is possible to set up a buy position above the pattern’s high of 521.82, with the prospect
Открыть график инструмента в новом окне


