

Pola sebenarnya

Bullish Rectangle
was formed on 31.03 at 05:26:24 (UTC+0)
signal strength 1 of 5
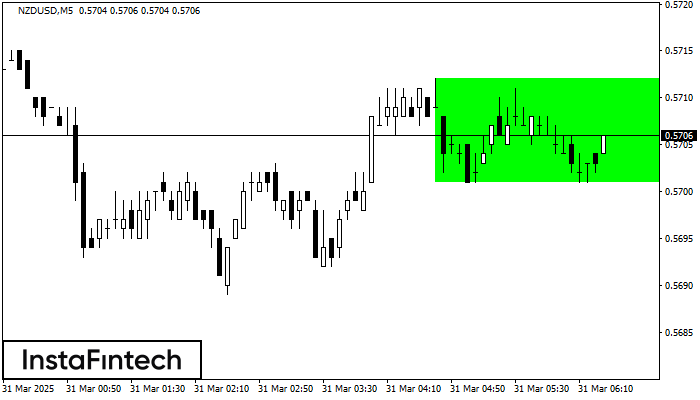
According to the chart of M5, NZDUSD formed the Bullish Rectangle. This type of a pattern indicates a trend continuation. It consists of two levels: resistance 0.5712 and support 0.5701. In case the resistance level 0.5712 - 0.5712 is broken, the instrument is likely to follow the bullish trend.
The M5 and M15 time frames may have more false entry points.
- All
- All
- Bearish Rectangle
- Bearish Symmetrical Triangle
- Bearish Symmetrical Triangle
- Bullish Rectangle
- Double Top
- Double Top
- Triple Bottom
- Triple Bottom
- Triple Top
- Triple Top
- All
- All
- Buy
- Sale
- All
- 1
- 2
- 3
- 4
- 5
Bawah Triple
was formed on 21.05 at 10:00:16 (UTC+0)
signal strength 4 of 5
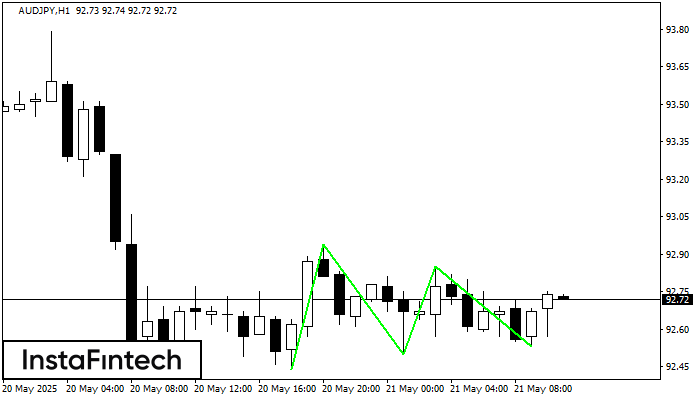
Pola Bawah Triple telah terbentuk pada AUDJPY H1. Pola tersebut memiliki karakteristik sebagai berikut: level resistance 92.94/92.85; level support 92.44/92.53; dengan lebar 50 poin. Jika terjadi pemecahan (breakdown) pada level
Open chart in a new window
Bawah Ganda
was formed on 21.05 at 10:00:05 (UTC+0)
signal strength 3 of 5
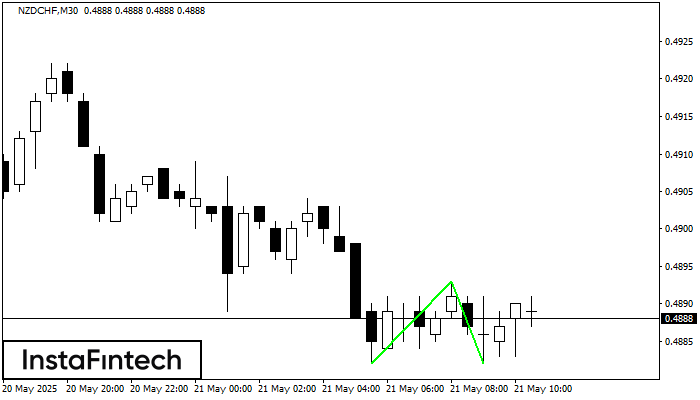
Pola Bawah Ganda telah terbentuk pada NZDCHF M30. Karakteristik: level support 0.4882; level resistance 0.4893; lebar pola 11 poin. Jika level resistance ditembus, perubahan dalam tren dapat diprediksi dengan target
Open chart in a new window
Bawah Ganda
was formed on 21.05 at 09:30:46 (UTC+0)
signal strength 2 of 5
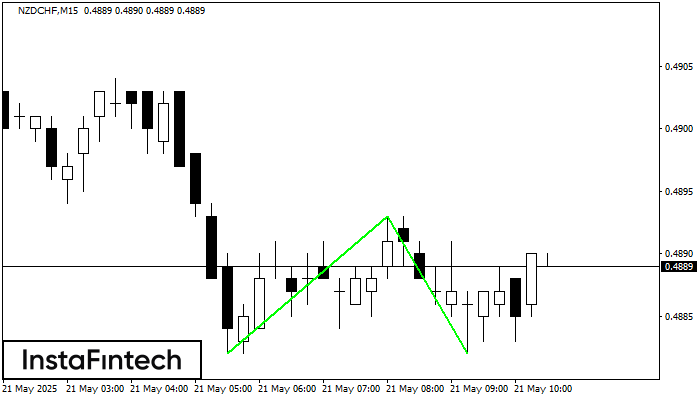
Pola Bawah Ganda telah terbentuk pada NZDCHF M15. Karakteristik: level support 0.4882; level resistance 0.4893; lebar pola 11 poin. Jika level resistance ditembus, perubahan dalam tren dapat diprediksi dengan target
Rangka waktu M5 dan M15 mungkin memiliki lebih dari titik entri yang keliru.
Open chart in a new window


