

Pola sebenarnya

Bearish pennant
was formed on 31.03 at 01:30:12 (UTC+0)
signal strength 2 of 5
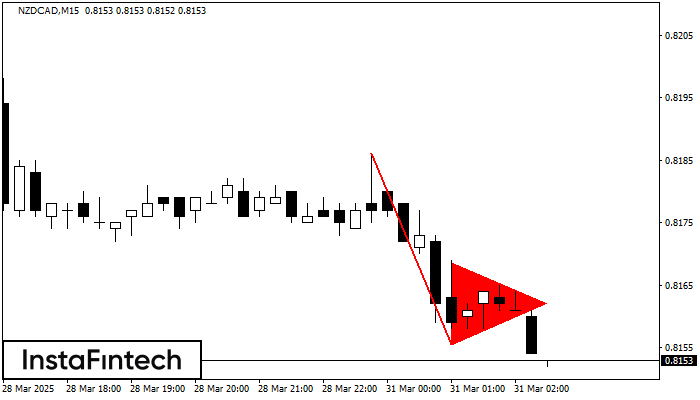
The Bearish pennant pattern has formed on the NZDCAD M15 chart. This pattern type is characterized by a slight slowdown after which the price will move in the direction of the original trend. In case the price fixes below the pattern’s low of 0.8156, a trader will be able to successfully enter the sell position.
The M5 and M15 time frames may have more false entry points.
- All
- All
- Bearish Rectangle
- Bearish Symmetrical Triangle
- Bearish Symmetrical Triangle
- Bullish Rectangle
- Double Top
- Double Top
- Triple Bottom
- Triple Bottom
- Triple Top
- Triple Top
- All
- All
- Buy
- Sale
- All
- 1
- 2
- 3
- 4
- 5
Kepala dan Bahu Terbalik
was formed on 21.05 at 10:40:34 (UTC+0)
signal strength 1 of 5
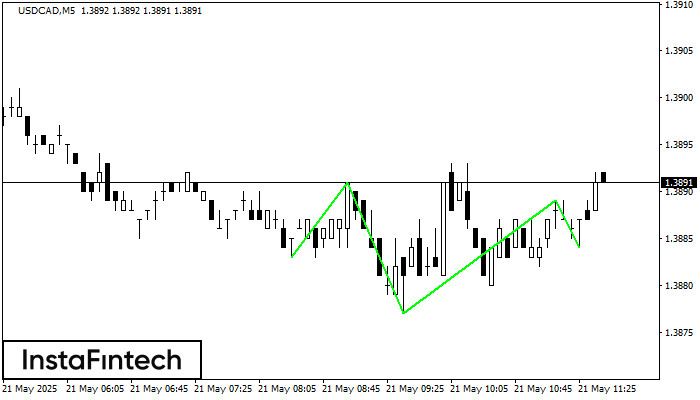
Menurut grafik dari M5, USDCAD membentuk pola Kepala dan Bahu Terbalik. Puncak kepala (Head) ditetapkan di 1.3889 sementara garis median leher (Neck) ditemukan di 1.3877/1.3884. Formasi pola Kepala dan Bahu
Rangka waktu M5 dan M15 mungkin memiliki lebih dari titik entri yang keliru.
Open chart in a new window
Bawah Triple
was formed on 21.05 at 10:00:16 (UTC+0)
signal strength 4 of 5
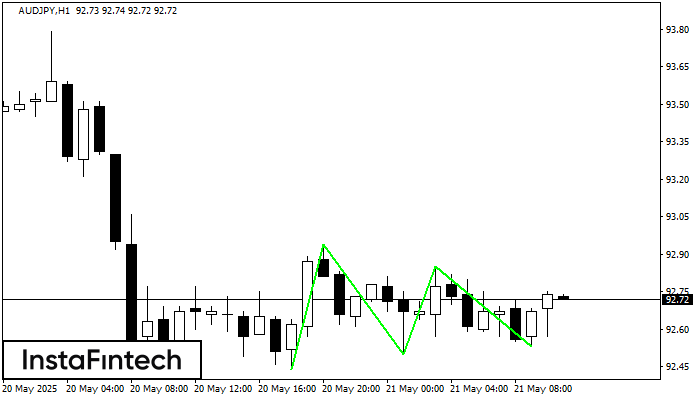
Pola Bawah Triple telah terbentuk pada AUDJPY H1. Pola tersebut memiliki karakteristik sebagai berikut: level resistance 92.94/92.85; level support 92.44/92.53; dengan lebar 50 poin. Jika terjadi pemecahan (breakdown) pada level
Open chart in a new window
Bawah Ganda
was formed on 21.05 at 10:00:05 (UTC+0)
signal strength 3 of 5
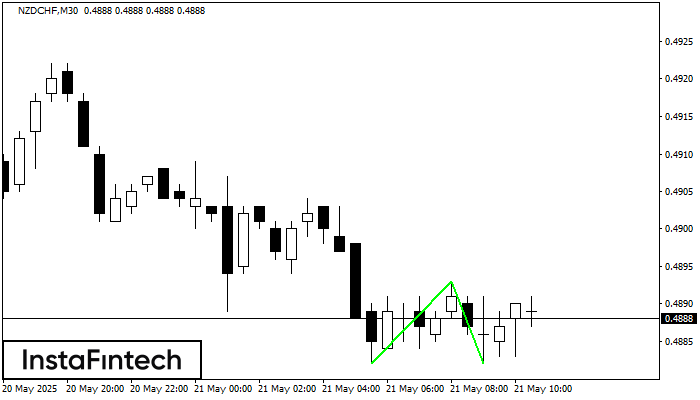
Pola Bawah Ganda telah terbentuk pada NZDCHF M30. Karakteristik: level support 0.4882; level resistance 0.4893; lebar pola 11 poin. Jika level resistance ditembus, perubahan dalam tren dapat diprediksi dengan target
Open chart in a new window


