

Pola sebenarnya

Bearish pennant
was formed on 31.03 at 01:15:38 (UTC+0)
signal strength 2 of 5

The Bearish pennant pattern has formed on the AUDUSD M15 chart. It signals potential continuation of the existing trend. Specifications: the pattern’s bottom has the coordinate of 0.6272; the projection of the flagpole height is equal to 19 pips. In case the price breaks out the pattern’s bottom of 0.6272, the downtrend is expected to continue for further level 0.6249.
The M5 and M15 time frames may have more false entry points.
Lihat juga
- All
- All
- Bearish Rectangle
- Bearish Symmetrical Triangle
- Bearish Symmetrical Triangle
- Bullish Rectangle
- Double Top
- Double Top
- Triple Bottom
- Triple Bottom
- Triple Top
- Triple Top
- All
- All
- Buy
- Sale
- All
- 1
- 2
- 3
- 4
- 5
Teratas Triple
was formed on 09.04 at 11:59:50 (UTC+0)
signal strength 1 of 5
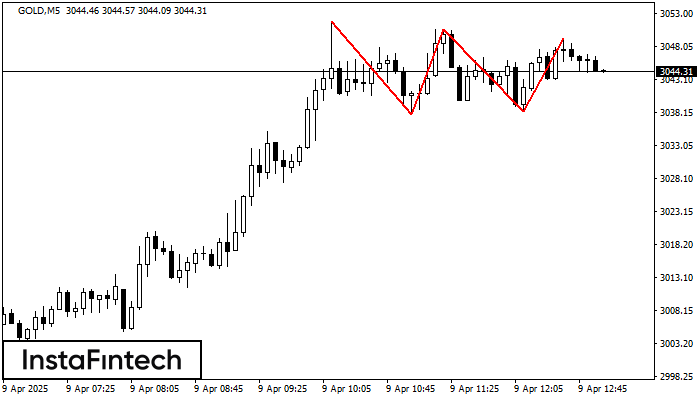
Pada grafik instrumen trading GOLD M5, pola Teratas Triple yang menandakan perubahan trend telah terbentuk. Ada kemungkinan bahwa setelah pembentukan puncak (peak) ketiga, harga akan mencoba untuk menembus level resistance
Rangka waktu M5 dan M15 mungkin memiliki lebih dari titik entri yang keliru.
Open chart in a new window
Segitiga Simetris Bullish
was formed on 09.04 at 11:56:23 (UTC+0)
signal strength 1 of 5
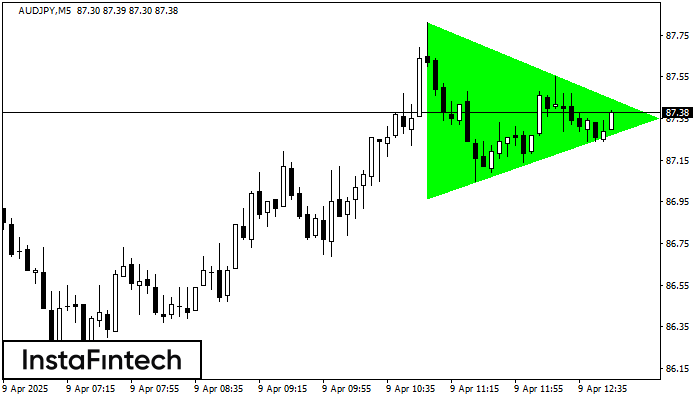
Menurut Grafik dari M5, AUDJPY dibentuk pola Segitiga Simetris Bullish, yang menunjukkan tren akan berlanjut. Deksripsi. Batas atas dari pola menyentuh kordinat 87.81/87.35 dimana batas yang lebih rendah berada sepanjang
Rangka waktu M5 dan M15 mungkin memiliki lebih dari titik entri yang keliru.
Open chart in a new window
Teratas Triple
was formed on 09.04 at 11:34:58 (UTC+0)
signal strength 1 of 5

Pada grafik instrumen trading NZDUSD M5, pola Teratas Triple yang menandakan perubahan trend telah terbentuk. Ada kemungkinan bahwa setelah pembentukan puncak (peak) ketiga, harga akan mencoba untuk menembus level resistance
Rangka waktu M5 dan M15 mungkin memiliki lebih dari titik entri yang keliru.
Open chart in a new window


