

Pola sebenarnya

Triple Top
was formed on 30.03 at 23:45:26 (UTC+0)
signal strength 2 of 5
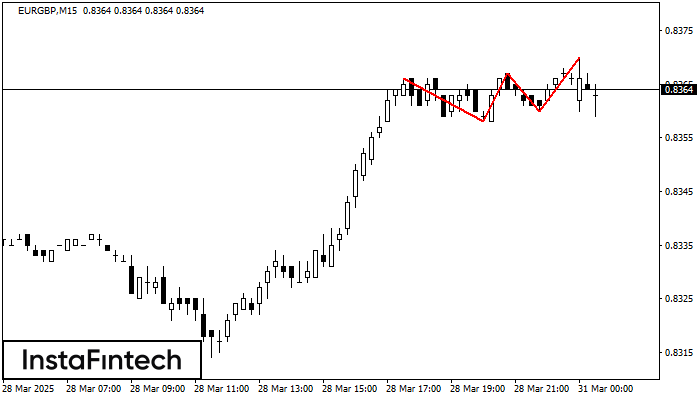
The Triple Top pattern has formed on the chart of the EURGBP M15. Features of the pattern: borders have an ascending angle; the lower line of the pattern has the coordinates 0.8358/0.8360 with the upper limit 0.8366/0.8370; the projection of the width is 8 points. The formation of the Triple Top figure most likely indicates a change in the trend from upward to downward. This means that in the event of a breakdown of the support level of 0.8358, the price is most likely to continue the downward movement.
The M5 and M15 time frames may have more false entry points.
Lihat juga
- All
- All
- Bearish Rectangle
- Bearish Symmetrical Triangle
- Bearish Symmetrical Triangle
- Bullish Rectangle
- Double Top
- Double Top
- Triple Bottom
- Triple Bottom
- Triple Top
- Triple Top
- All
- All
- Buy
- Sale
- All
- 1
- 2
- 3
- 4
- 5
Persegi Bearish
was formed on 16.05 at 21:06:23 (UTC+0)
signal strength 1 of 5

Menurut grafik dari M5, EURNZD terbentuk Persegi Bearish yang merupakan pola dari kelanjutan tren. Pola terkandung di dalam batas berikut: batas lebih rendah 1.8961 – 1.8961 dan batas atas 1.8969
Rangka waktu M5 dan M15 mungkin memiliki lebih dari titik entri yang keliru.
Open chart in a new window
Teratas Ganda
was formed on 16.05 at 21:00:38 (UTC+0)
signal strength 2 of 5
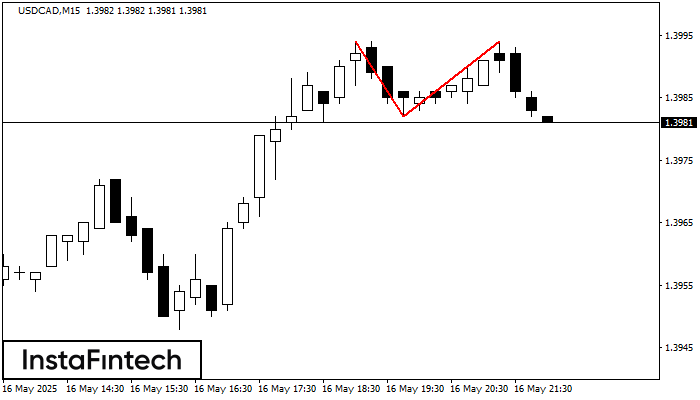
Pola Teratas Ganda telah terbentuk pada USDCAD M15. Pola ini menandakan bahwa tren telah berubah dari kenaikan menjadi penurunan. Mungkin, jika dasar pola di 1.3982 ditembus, maka pergerakan menurun akan
Rangka waktu M5 dan M15 mungkin memiliki lebih dari titik entri yang keliru.
Open chart in a new window
Panji Bullish
was formed on 16.05 at 21:00:37 (UTC+0)
signal strength 3 of 5

Pola Panji Bullish terbentuk di grafik #EBAY M30. Ini adalah jenis pola kelanjutan. Diduga, jika harga ditetapkan di atas titik tertinggi panji di 71.89, tren naik selanjutnya mungkin terjadi
Open chart in a new window


