

Pola sebenarnya

Triple Bottom
was formed on 28.03 at 13:10:00 (UTC+0)
signal strength 1 of 5
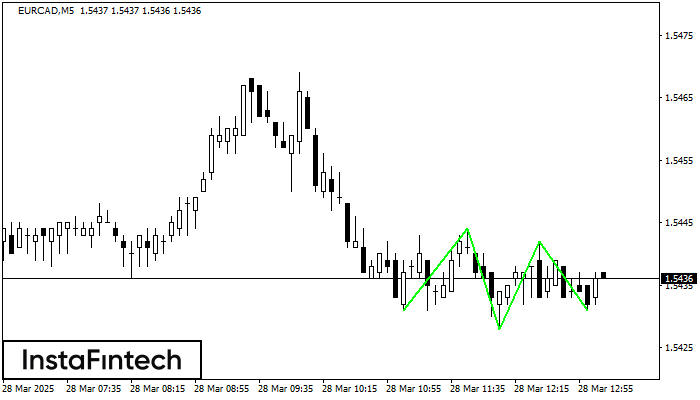
The Triple Bottom pattern has formed on the chart of EURCAD M5. Features of the pattern: The lower line of the pattern has coordinates 1.5444 with the upper limit 1.5444/1.5442, the projection of the width is 13 points. The formation of the Triple Bottom pattern most likely indicates a change in the trend from downward to upward. This means that in the event of a breakdown of the resistance level 1.5431, the price is most likely to continue the upward movement.
The M5 and M15 time frames may have more false entry points.
- All
- All
- Bearish Rectangle
- Bearish Symmetrical Triangle
- Bearish Symmetrical Triangle
- Bullish Rectangle
- Double Top
- Double Top
- Triple Bottom
- Triple Bottom
- Triple Top
- Triple Top
- All
- All
- Buy
- Sale
- All
- 1
- 2
- 3
- 4
- 5
Persegi Bullish
was formed on 23.05 at 06:32:41 (UTC+0)
signal strength 1 of 5
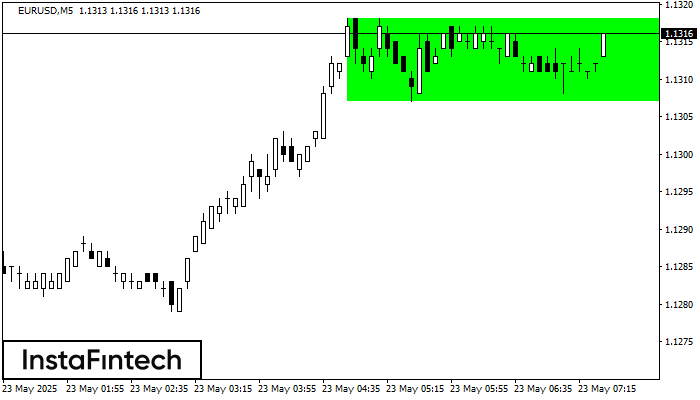
Menurut grafik dari M5, EURUSD terbentuk Persegi Bullish. Jenis pola ini menunjukkan kelanjutan tren. Terdiri dari dua tingkat: resistance 1.1318 dan support 1.1307. Jika level resistance 1.1318 - 1.1318 ditembus
Rangka waktu M5 dan M15 mungkin memiliki lebih dari titik entri yang keliru.
Open chart in a new window
Teratas Ganda
was formed on 23.05 at 06:04:11 (UTC+0)
signal strength 3 of 5
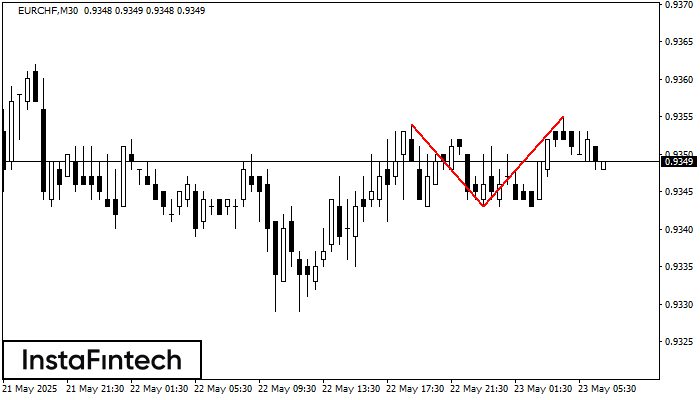
Pola Teratas Ganda telah terbentuk pada EURCHF M30. Pola ini menandakan bahwa tren telah berubah dari kenaikan menjadi penurunan. Mungkin, jika dasar pola di 0.9343 ditembus, maka pergerakan menurun akan
Open chart in a new window
Teratas Triple
was formed on 23.05 at 06:00:18 (UTC+0)
signal strength 4 of 5
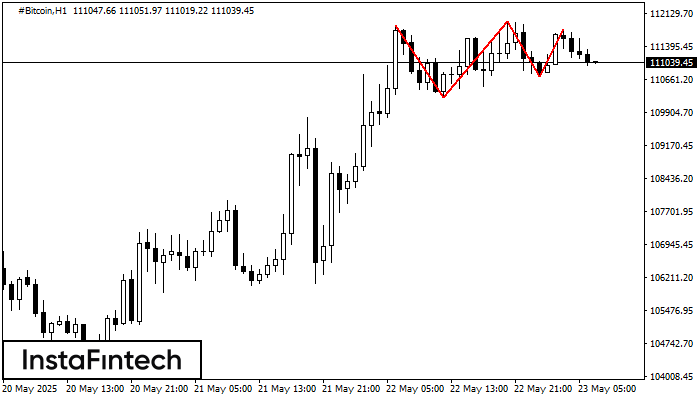
Pola Teratas Triple telah terbentuk pada grafik #Bitcoin H1. Fitur-fitur pola: perbatasan memiliki sudut yang naik; batas bawah pola memiliki koordinat 110239.46/110716.22 dengan batas atas 111866.54/111770.50; proyeksi lebar adalah 162708
Open chart in a new window


