

Pola sebenarnya

Bearish Symmetrical Triangle
was formed on 28.03 at 13:02:25 (UTC+0)
signal strength 2 of 5
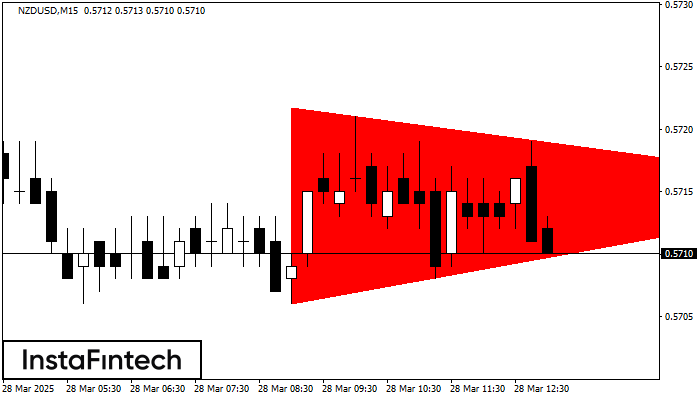
According to the chart of M15, NZDUSD formed the Bearish Symmetrical Triangle pattern. This pattern signals a further downward trend in case the lower border 0.5706 is breached. Here, a hypothetical profit will equal the width of the available pattern that is -16 pips.
The M5 and M15 time frames may have more false entry points.
Lihat juga
- All
- All
- Bearish Rectangle
- Bearish Symmetrical Triangle
- Bearish Symmetrical Triangle
- Bullish Rectangle
- Double Top
- Double Top
- Triple Bottom
- Triple Bottom
- Triple Top
- Triple Top
- All
- All
- Buy
- Sale
- All
- 1
- 2
- 3
- 4
- 5
Bawah Ganda
was formed on 22.04 at 07:00:30 (UTC+0)
signal strength 1 of 5
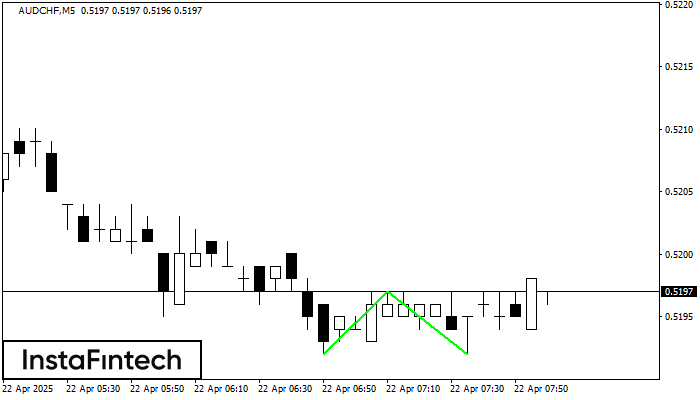
Pola Bawah Ganda telah terbentuk pada AUDCHF M5; batas atas di 0.5197; batas bawah di 0.5192. Lebar pola sebesar 5 poin. Jika harga menembus batas atas 0.5197, Perubahan dalam tren
Rangka waktu M5 dan M15 mungkin memiliki lebih dari titik entri yang keliru.
Open chart in a new window
Teratas Ganda
was formed on 22.04 at 06:46:04 (UTC+0)
signal strength 1 of 5
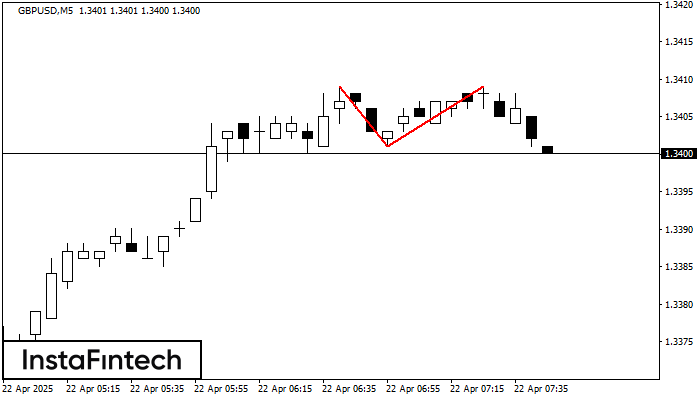
Pada grafik GBPUSD M5 pola reversal Teratas Ganda telah terbentuk. Karakteristik: batas atas 1.3409; batas bawah 1.3401; lebar pola 8 poin. Sinyal: tembusan ke batas bawah akan menyebabkan kelanjutan tren
Rangka waktu M5 dan M15 mungkin memiliki lebih dari titik entri yang keliru.
Open chart in a new window
Persegi Bearish
was formed on 22.04 at 06:31:47 (UTC+0)
signal strength 1 of 5
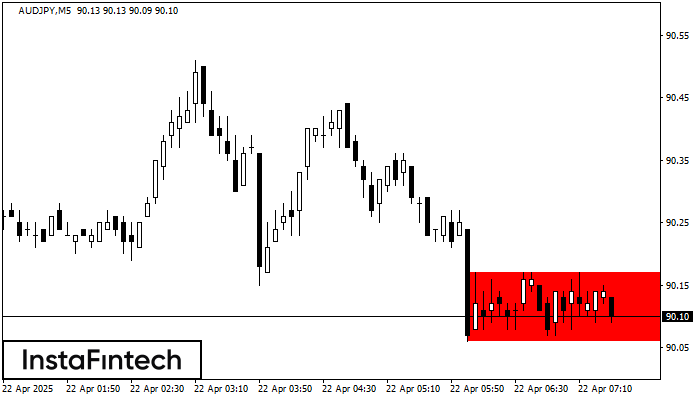
Menurut grafik dari M5, AUDJPY terbentuk Persegi Bearish. Jenis pola ini menunjukkan kelanjutan tren. Terdiri dari dua tingkat: resistance 90.17 - 0.00 dan support 90.06 – 90.06. Jika level resistance
Rangka waktu M5 dan M15 mungkin memiliki lebih dari titik entri yang keliru.
Open chart in a new window


