

Pola sebenarnya

Double Bottom
was formed on 27.03 at 09:15:39 (UTC+0)
signal strength 1 of 5
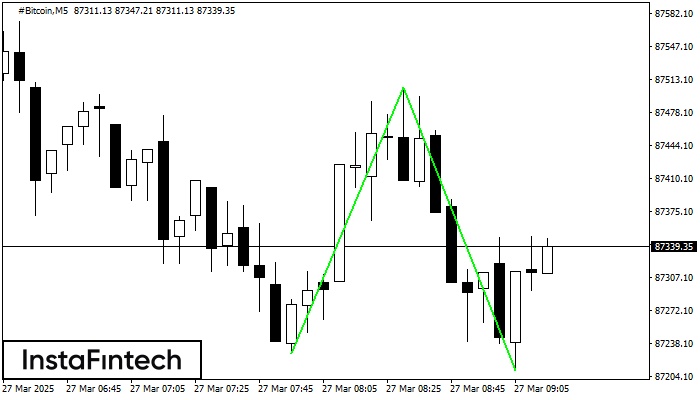
The Double Bottom pattern has been formed on #Bitcoin M5; the upper boundary is 87504.98; the lower boundary is 87210.25. The width of the pattern is 27754 points. In case of a break of the upper boundary 87504.98, a change in the trend can be predicted where the width of the pattern will coincide with the distance to a possible take profit level.
The M5 and M15 time frames may have more false entry points.
- All
- All
- Bearish Rectangle
- Bearish Symmetrical Triangle
- Bearish Symmetrical Triangle
- Bullish Rectangle
- Double Top
- Double Top
- Triple Bottom
- Triple Bottom
- Triple Top
- Triple Top
- All
- All
- Buy
- Sale
- All
- 1
- 2
- 3
- 4
- 5
Segitiga Simetris Bearish
was formed on 21.05 at 11:46:23 (UTC+0)
signal strength 3 of 5
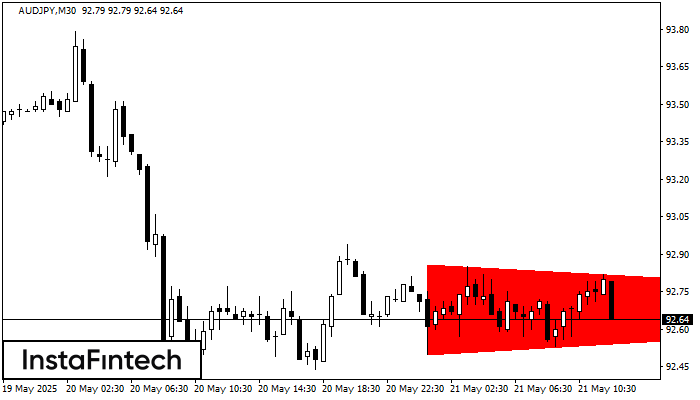
Menurut Grafik dari M30, AUDJPY dibentuk pola Segitiga Simetris Bearish. Pola ini mengisyaratkan tren penurunan lebih lanjut jika terdapat batas yang lebih rendah 92.50 ditembus. Disini, sebuah keuntungan hipotetis akan
Open chart in a new window
Teratas Ganda
was formed on 21.05 at 11:35:20 (UTC+0)
signal strength 1 of 5
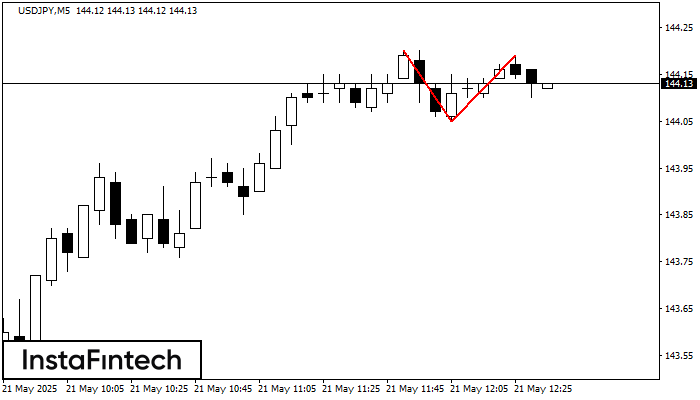
Pada grafik USDJPY M5 pola reversal Teratas Ganda telah terbentuk. Karakteristik: batas atas 144.19; batas bawah 144.05; lebar pola 14 poin. Sinyal: tembusan ke batas bawah akan menyebabkan kelanjutan tren
Rangka waktu M5 dan M15 mungkin memiliki lebih dari titik entri yang keliru.
Open chart in a new window
Persegi Bullish
was formed on 21.05 at 11:35:00 (UTC+0)
signal strength 1 of 5
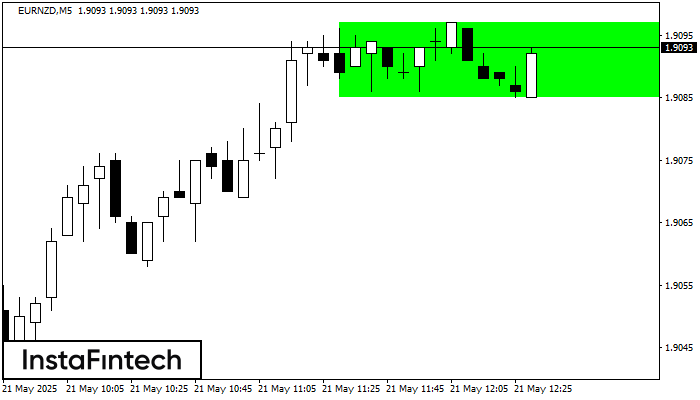
Menurut grafik dari M5, EURNZD terbentuk Persegi Bullish yang merupakan pola dari kelanjutan tren. Pola terkandung dalam batas berikut: batas yang lebih rendah 1.9085 – 1.9085 dan batas atas 1.9097
Rangka waktu M5 dan M15 mungkin memiliki lebih dari titik entri yang keliru.
Open chart in a new window


