

Pola sebenarnya

Triple Bottom
was formed on 27.03 at 06:40:25 (UTC+0)
signal strength 1 of 5

The Triple Bottom pattern has formed on the chart of USDJPY M5. Features of the pattern: The lower line of the pattern has coordinates 150.29 with the upper limit 150.29/150.27, the projection of the width is 19 points. The formation of the Triple Bottom pattern most likely indicates a change in the trend from downward to upward. This means that in the event of a breakdown of the resistance level 150.10, the price is most likely to continue the upward movement.
The M5 and M15 time frames may have more false entry points.
Lihat juga
- All
- All
- Bearish Rectangle
- Bearish Symmetrical Triangle
- Bearish Symmetrical Triangle
- Bullish Rectangle
- Double Top
- Double Top
- Triple Bottom
- Triple Bottom
- Triple Top
- Triple Top
- All
- All
- Buy
- Sale
- All
- 1
- 2
- 3
- 4
- 5
ডাবল বটম
was formed on 22.04 at 19:15:32 (UTC+0)
signal strength 1 of 5
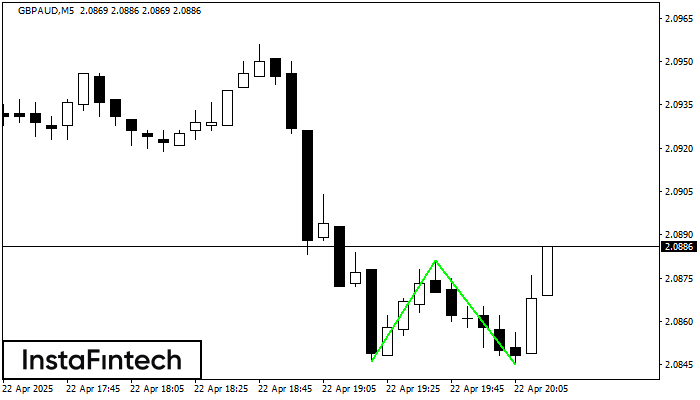
M5 চার্টে, GBPAUD-এর ডাবল বটম প্যাটার্নটি গঠিত হয়েছে। উপরের সীমানা হল 2.0881; নীচের সীমানা হল 2.0845। প্যাটার্নের প্রস্থ হল 35 পয়েন্ট। 2.0881-এর উপরের সীমানা ভেদ করার ক্ষেত্রে, প্রবণতা পরিবর্তনের পূর্বাভাস
M5 এবং M15 টাইম ফ্রেমে আরও ভুল এন্ট্রি পয়েন্ট থাকতে পারে।
Open chart in a new window
ট্রিপল টপ
was formed on 22.04 at 19:15:08 (UTC+0)
signal strength 1 of 5
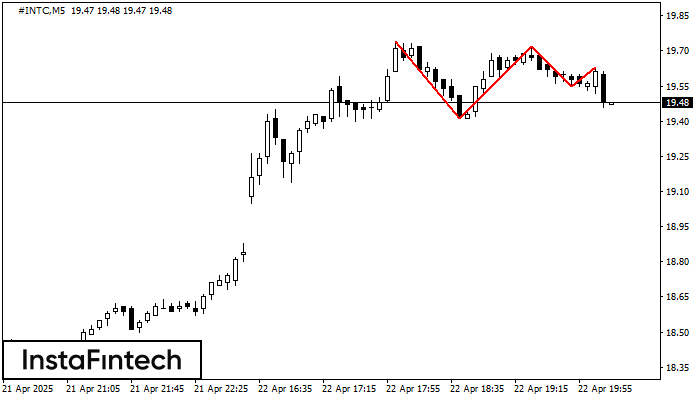
M5 চার্টে #INTC-এর ট্রিপল টপ প্যাটার্নটি গঠিত হয়েছে। প্যাটার্নের বৈশিষ্ট্য: এই প্যাটার্নের সীমানাগুলোতে একটি ঊর্ধ্বমুখী অ্যাঙ্গেল বা কোণ আছে; প্যাটার্নের নীচের লাইনে 19.41/19.55-এর কোঅর্ডিনেট রয়েছে, উপরের সীমা 19.74/19.63; প্রস্থের প্রজেকশন
M5 এবং M15 টাইম ফ্রেমে আরও ভুল এন্ট্রি পয়েন্ট থাকতে পারে।
Open chart in a new window
ডাবল টপ
was formed on 22.04 at 19:05:20 (UTC+0)
signal strength 1 of 5
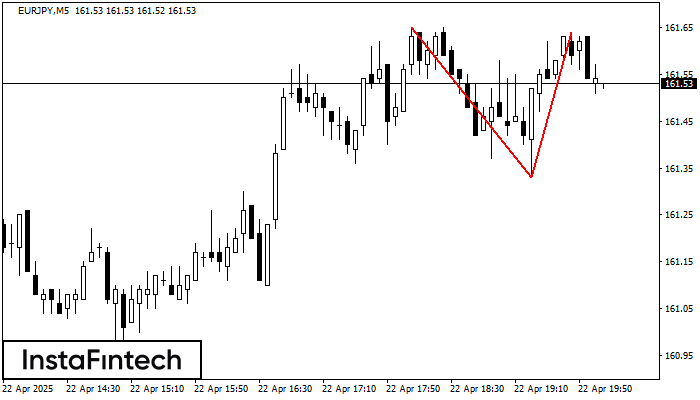
M5 চার্টে, EURJPY-এর ডাবল টপ প্যাটার্নটি গঠিত হয়েছে। এটি এই ইঙ্গিত দেয় যে চলমান প্রবণতা ঊর্ধ্বমুখী থেকে নিম্নমুখীতে পরিবর্তিত হয়েছে। সম্ভবত, যদি 161.33 প্যাটার্নের ভিত্তিটি ব্রেক করা হয়, তাহলে নিম্নমুখী
M5 এবং M15 টাইম ফ্রেমে আরও ভুল এন্ট্রি পয়েন্ট থাকতে পারে।
Open chart in a new window


