

Pola sebenarnya

Double Top
was formed on 27.03 at 04:40:34 (UTC+0)
signal strength 1 of 5
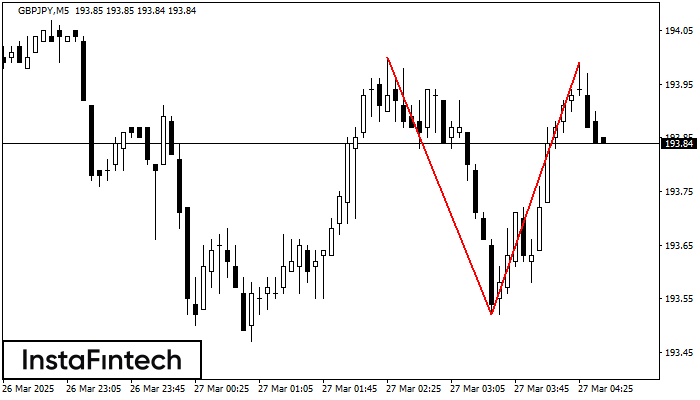
On the chart of GBPJPY M5 the Double Top reversal pattern has been formed. Characteristics: the upper boundary 193.99; the lower boundary 193.52; the width of the pattern 47 points. The signal: a break of the lower boundary will cause continuation of the downward trend targeting the 193.37 level.
The M5 and M15 time frames may have more false entry points.
- All
- All
- Bearish Rectangle
- Bearish Symmetrical Triangle
- Bearish Symmetrical Triangle
- Bullish Rectangle
- Double Top
- Double Top
- Triple Bottom
- Triple Bottom
- Triple Top
- Triple Top
- All
- All
- Buy
- Sale
- All
- 1
- 2
- 3
- 4
- 5
Double Top
was formed on 13.05 at 00:30:10 (UTC+0)
signal strength 1 of 5
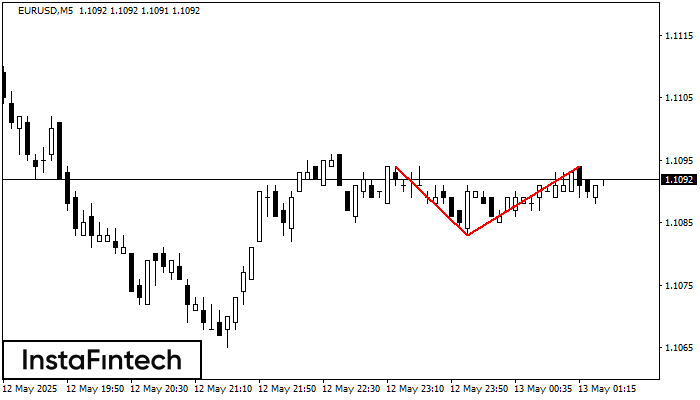
The Double Top reversal pattern has been formed on EURUSD M5. Characteristics: the upper boundary 1.1094; the lower boundary 1.1083; the width of the pattern is 11 points. Sell trades
The M5 and M15 time frames may have more false entry points.
Open chart in a new window
Bearish Symmetrical Triangle
was formed on 13.05 at 00:18:16 (UTC+0)
signal strength 1 of 5
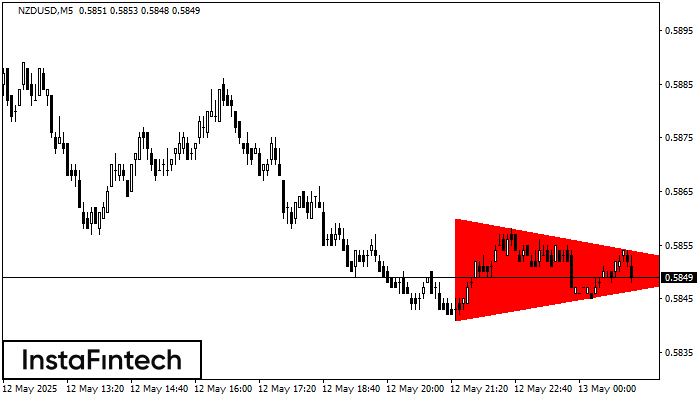
According to the chart of M5, NZDUSD formed the Bearish Symmetrical Triangle pattern. Trading recommendations: A breach of the lower border 0.5841 is likely to encourage a continuation
The M5 and M15 time frames may have more false entry points.
Open chart in a new window
Double Top
was formed on 13.05 at 00:00:08 (UTC+0)
signal strength 4 of 5
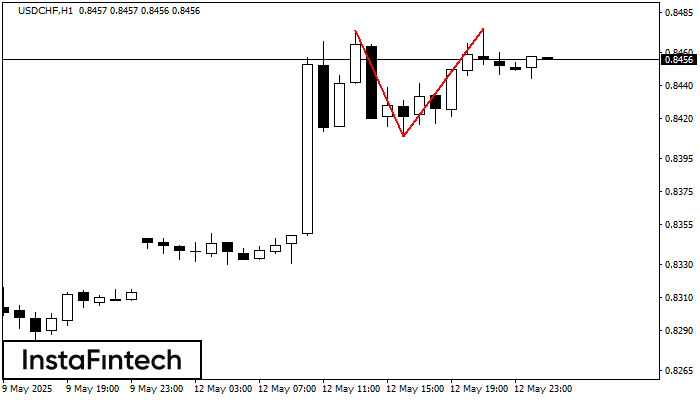
The Double Top reversal pattern has been formed on USDCHF H1. Characteristics: the upper boundary 0.8474; the lower boundary 0.8409; the width of the pattern is 66 points. Sell trades
Open chart in a new window

