

Pola sebenarnya

Bearish Symmetrical Triangle
was formed on 27.03 at 03:36:21 (UTC+0)
signal strength 1 of 5
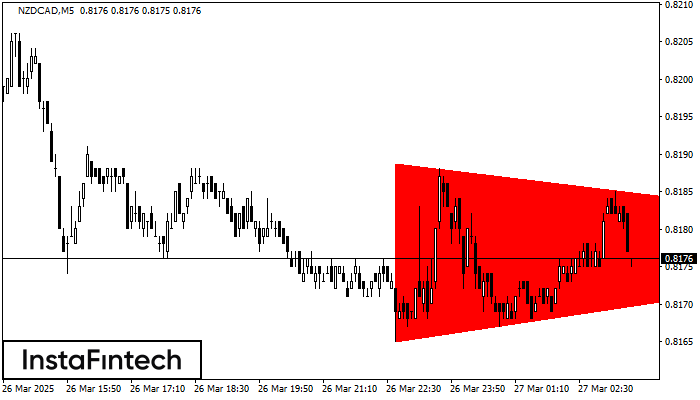
According to the chart of M5, NZDCAD formed the Bearish Symmetrical Triangle pattern. This pattern signals a further downward trend in case the lower border 0.8165 is breached. Here, a hypothetical profit will equal the width of the available pattern that is -24 pips.
The M5 and M15 time frames may have more false entry points.
Lihat juga
- All
- All
- Bearish Rectangle
- Bearish Symmetrical Triangle
- Bearish Symmetrical Triangle
- Bullish Rectangle
- Double Top
- Double Top
- Triple Bottom
- Triple Bottom
- Triple Top
- Triple Top
- All
- All
- Buy
- Sale
- All
- 1
- 2
- 3
- 4
- 5
Bawah Ganda
was formed on 15.04 at 15:59:49 (UTC+0)
signal strength 4 of 5
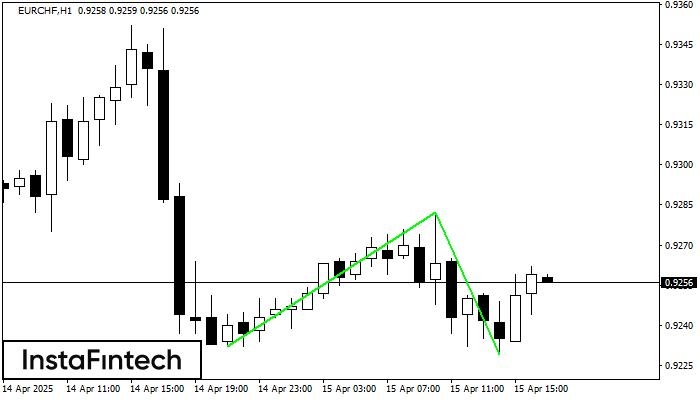
Pola Bawah Ganda telah terbentuk pada EURCHF H1. Karakteristik: level support 0.9232; level resistance 0.9282; lebar pola 50 poin. Jika level resistance ditembus, perubahan dalam tren dapat diprediksi dengan target
Open chart in a new window
Teratas Ganda
was formed on 15.04 at 15:59:45 (UTC+0)
signal strength 3 of 5
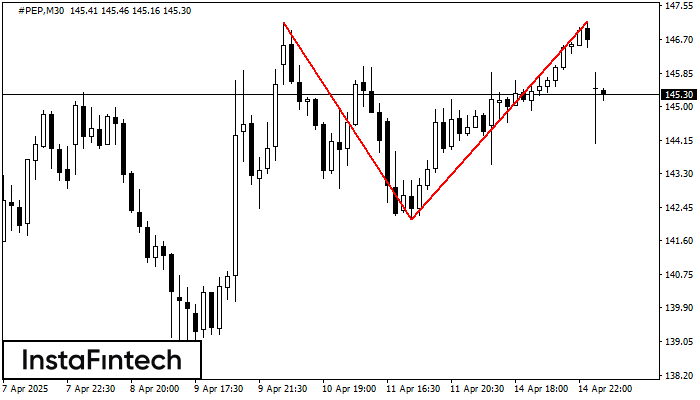
Pada grafik #PEP M30 pola reversal Teratas Ganda telah terbentuk. Karakteristik: batas atas 147.15; batas bawah 142.13; lebar pola 502 poin. Sinyal: tembusan ke batas bawah akan menyebabkan kelanjutan tren
Open chart in a new window
Teratas Ganda
was formed on 15.04 at 15:59:44 (UTC+0)
signal strength 3 of 5
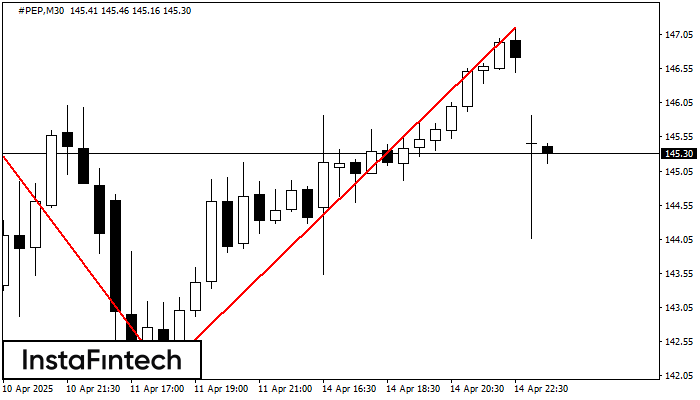
Pola Teratas Ganda telah terbentuk pada #PEP M30. Pola ini menandakan bahwa tren telah berubah dari kenaikan menjadi penurunan. Mungkin, jika dasar pola di 142.13 ditembus, maka pergerakan menurun akan
Open chart in a new window


