

Pola sebenarnya

Inverse Head and Shoulder
was formed on 27.03 at 03:05:48 (UTC+0)
signal strength 1 of 5

According to the chart of M5, NZDUSD formed the Inverse Head and Shoulder pattern. The Head’s top is set at 0.5723 while the median line of the Neck is found at 0.5705/0.5719. The formation of the Inverse Head and Shoulder pattern evidently signals a reversal of the downward trend. In other words, in case the scenario comes true, the price of NZDUSD will go towards 0.5738
The M5 and M15 time frames may have more false entry points.
Lihat juga
- All
- All
- Bearish Rectangle
- Bearish Symmetrical Triangle
- Bearish Symmetrical Triangle
- Bullish Rectangle
- Double Top
- Double Top
- Triple Bottom
- Triple Bottom
- Triple Top
- Triple Top
- All
- All
- Buy
- Sale
- All
- 1
- 2
- 3
- 4
- 5
Persegi Bearish
was formed on 15.05 at 20:20:21 (UTC+0)
signal strength 2 of 5
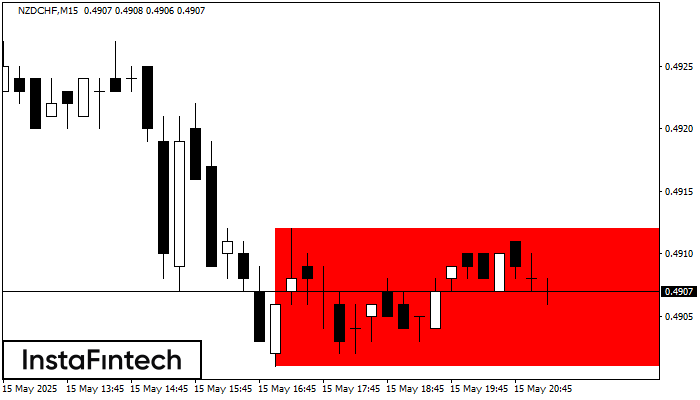
Menurut grafik dari M15, NZDCHF terbentuk Persegi Bearish. Pola menunjukkan kelanjutan tren. Batas atas adalah 0.4912, batas rendah adalah 0.4901. Sinyal berarti posisi jual harus dibuka setelah menetapkan harga dibawah
Rangka waktu M5 dan M15 mungkin memiliki lebih dari titik entri yang keliru.
Open chart in a new window
Persegi Bearish
was formed on 15.05 at 20:20:21 (UTC+0)
signal strength 2 of 5
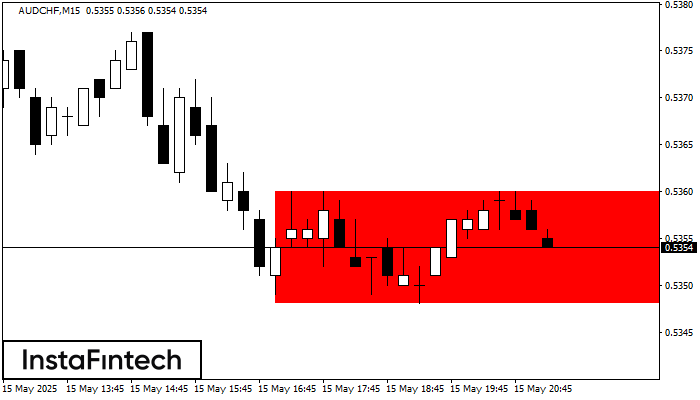
Menurut grafik dari M15, AUDCHF terbentuk Persegi Bearish. Jenis pola ini menunjukkan kelanjutan tren. Terdiri dari dua tingkat: resistance 0.5360 - 0.0000 dan support 0.5348 – 0.5348. Jika level resistance
Rangka waktu M5 dan M15 mungkin memiliki lebih dari titik entri yang keliru.
Open chart in a new window
Teratas Ganda
was formed on 15.05 at 20:00:20 (UTC+0)
signal strength 3 of 5
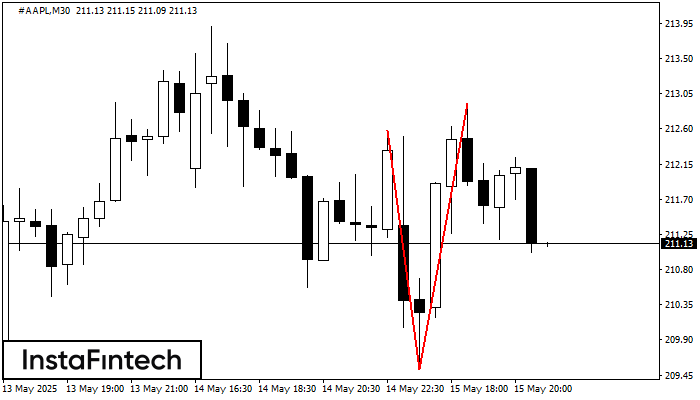
Pola reversal Teratas Ganda telah terbentuk pada #AAPL M30. Karakteristik: batas atas 212.58; batas bawah 209.52; lebar pola 341 poin. Transaksi jual lebih baik dibuka di bawah batas bawah 209.52
Open chart in a new window


