

Pola sebenarnya

Double Top
was formed on 27.03 at 00:00:20 (UTC+0)
signal strength 5 of 5
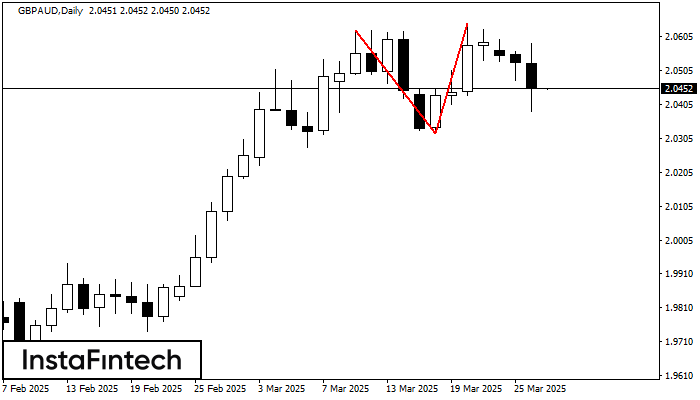
On the chart of GBPAUD D1 the Double Top reversal pattern has been formed. Characteristics: the upper boundary 2.0644; the lower boundary 2.0321; the width of the pattern 323 points. The signal: a break of the lower boundary will cause continuation of the downward trend targeting the 2.0281 level.
Lihat juga
- All
- All
- Bearish Rectangle
- Bearish Symmetrical Triangle
- Bearish Symmetrical Triangle
- Bullish Rectangle
- Double Top
- Double Top
- Triple Bottom
- Triple Bottom
- Triple Top
- Triple Top
- All
- All
- Buy
- Sale
- All
- 1
- 2
- 3
- 4
- 5
Double Top
was formed on 16.05 at 21:25:08 (UTC+0)
signal strength 1 of 5
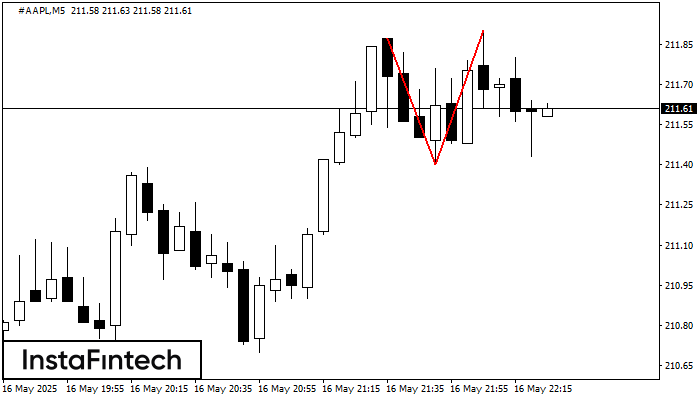
The Double Top reversal pattern has been formed on #AAPL M5. Characteristics: the upper boundary 211.87; the lower boundary 211.40; the width of the pattern is 50 points. Sell trades
The M5 and M15 time frames may have more false entry points.
Open chart in a new window
Bullish Rectangle
was formed on 16.05 at 21:15:39 (UTC+0)
signal strength 1 of 5
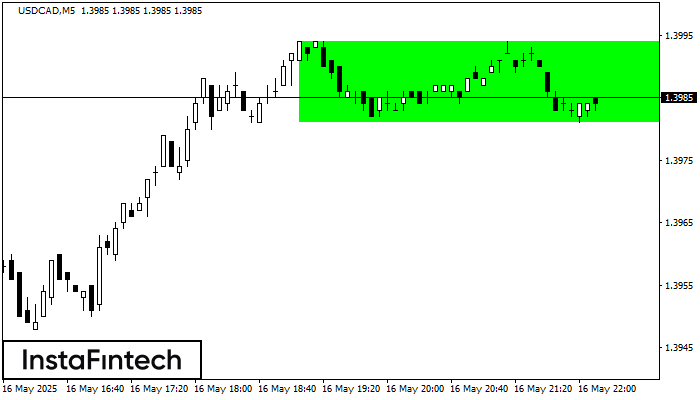
According to the chart of M5, USDCAD formed the Bullish Rectangle. The pattern indicates a trend continuation. The upper border is 1.3994, the lower border is 1.3981. The signal means
The M5 and M15 time frames may have more false entry points.
Open chart in a new window
Bearish Rectangle
was formed on 16.05 at 21:06:23 (UTC+0)
signal strength 1 of 5

According to the chart of M5, EURNZD formed the Bearish Rectangle which is a pattern of a trend continuation. The pattern is contained within the following borders: lower border 1.8961
The M5 and M15 time frames may have more false entry points.
Open chart in a new window


