

Pola sebenarnya

Double Bottom
was formed on 27.03 at 00:00:09 (UTC+0)
signal strength 4 of 5
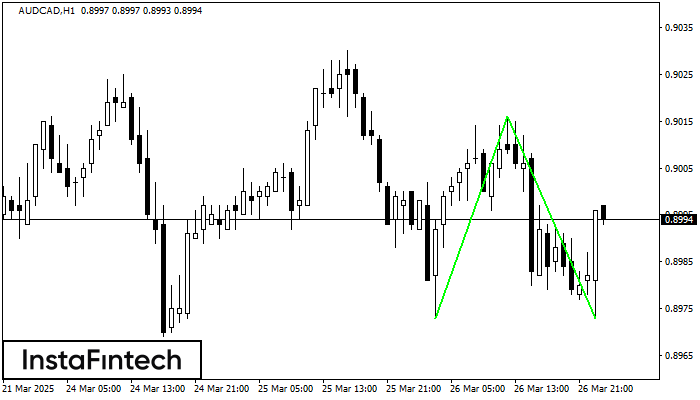
The Double Bottom pattern has been formed on AUDCAD H1; the upper boundary is 0.9016; the lower boundary is 0.8973. The width of the pattern is 43 points. In case of a break of the upper boundary 0.9016, a change in the trend can be predicted where the width of the pattern will coincide with the distance to a possible take profit level.
Lihat juga
- All
- All
- Bearish Rectangle
- Bearish Symmetrical Triangle
- Bearish Symmetrical Triangle
- Bullish Rectangle
- Double Top
- Double Top
- Triple Bottom
- Triple Bottom
- Triple Top
- Triple Top
- All
- All
- Buy
- Sale
- All
- 1
- 2
- 3
- 4
- 5
Teratas Triple
was formed on 16.05 at 09:05:33 (UTC+0)
signal strength 1 of 5
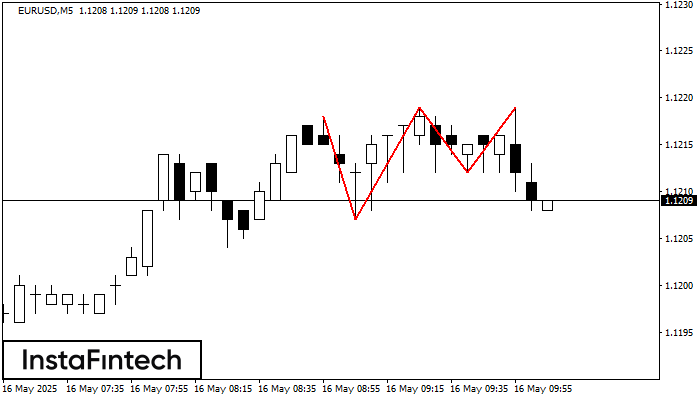
Pada grafik instrumen trading EURUSD M5, pola Teratas Triple yang menandakan perubahan trend telah terbentuk. Ada kemungkinan bahwa setelah pembentukan puncak (peak) ketiga, harga akan mencoba untuk menembus level resistance
Rangka waktu M5 dan M15 mungkin memiliki lebih dari titik entri yang keliru.
Open chart in a new window
Teratas Ganda
was formed on 16.05 at 08:31:00 (UTC+0)
signal strength 1 of 5
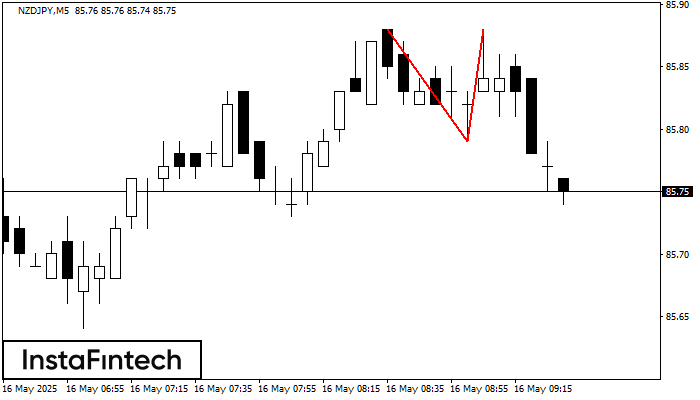
Pola Teratas Ganda telah terbentuk pada NZDJPY M5. Pola ini menandakan bahwa tren telah berubah dari kenaikan menjadi penurunan. Mungkin, jika dasar pola di 85.79 ditembus, maka pergerakan menurun akan
Rangka waktu M5 dan M15 mungkin memiliki lebih dari titik entri yang keliru.
Open chart in a new window
Teratas Triple
was formed on 16.05 at 08:20:22 (UTC+0)
signal strength 1 of 5
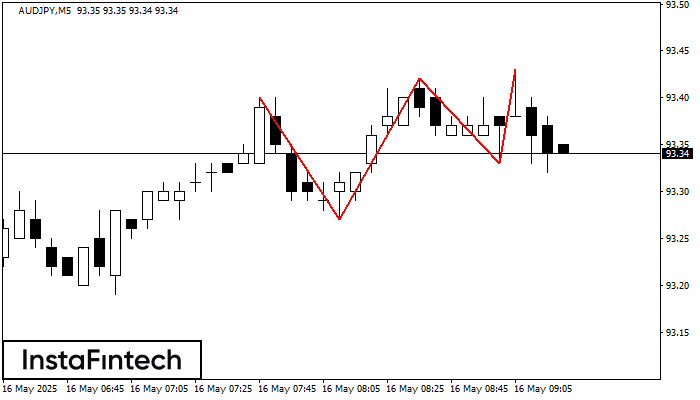
Pada grafik instrumen trading AUDJPY M5, pola Teratas Triple yang menandakan perubahan trend telah terbentuk. Ada kemungkinan bahwa setelah pembentukan puncak (peak) ketiga, harga akan mencoba untuk menembus level resistance
Rangka waktu M5 dan M15 mungkin memiliki lebih dari titik entri yang keliru.
Open chart in a new window


