

Pola sebenarnya

Bullish Rectangle
was formed on 26.03 at 01:00:45 (UTC+0)
signal strength 2 of 5
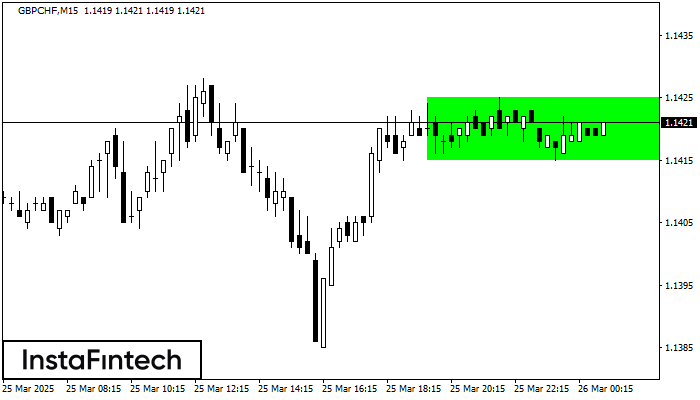
According to the chart of M15, GBPCHF formed the Bullish Rectangle. This type of a pattern indicates a trend continuation. It consists of two levels: resistance 1.1425 and support 1.1415. In case the resistance level 1.1425 - 1.1425 is broken, the instrument is likely to follow the bullish trend.
The M5 and M15 time frames may have more false entry points.
Lihat juga
- All
- All
- Bearish Rectangle
- Bearish Symmetrical Triangle
- Bearish Symmetrical Triangle
- Bullish Rectangle
- Double Top
- Double Top
- Triple Bottom
- Triple Bottom
- Triple Top
- Triple Top
- All
- All
- Buy
- Sale
- All
- 1
- 2
- 3
- 4
- 5
ডাবল টপ
was formed on 05.05 at 13:35:02 (UTC+0)
signal strength 1 of 5
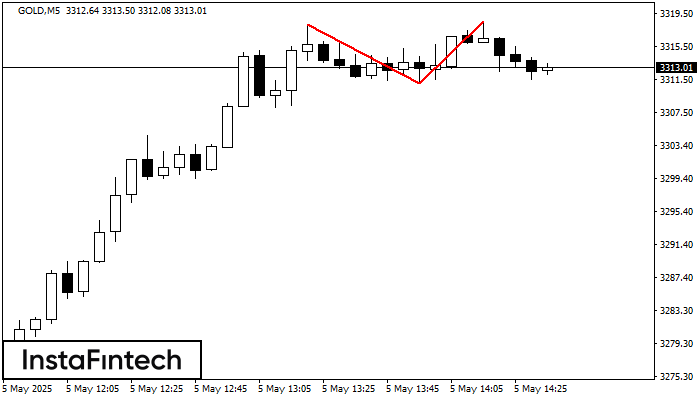
M5 চার্টে, GOLD-এর ডাবল টপ রিভার্সাল বা বিপরীতমুখী প্যাটার্ন গঠিত হয়েছে। বৈশিষ্ট্য: উপরের সীমানা 3318.18; নীচের সীমানা 3311.06; প্যাটার্নের প্রস্থ হল 746 পয়েন্ট। 3311.06 3310.91 স্তরের দিকে সম্ভাব্য মুভমেন্টের সাথে
M5 এবং M15 টাইম ফ্রেমে আরও ভুল এন্ট্রি পয়েন্ট থাকতে পারে।
Open chart in a new window
ডাবল বটম
was formed on 05.05 at 13:00:02 (UTC+0)
signal strength 2 of 5
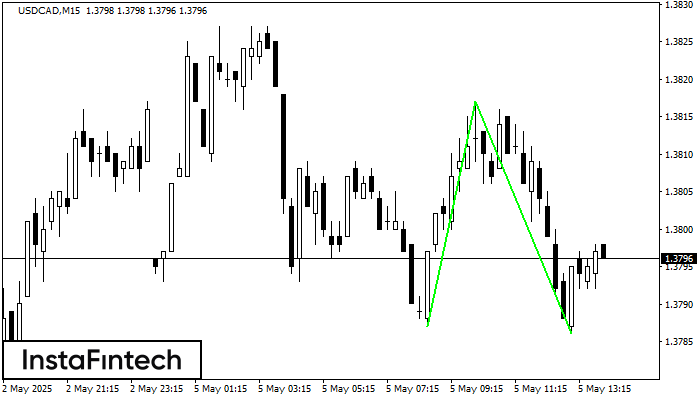
M15 চার্টে, USDCAD-এর ডাবল বটম প্যাটার্নটি গঠিত হয়েছে। উপরের সীমানা হল 1.3817; নীচের সীমানা হল 1.3786। প্যাটার্নের প্রস্থ হল 30 পয়েন্ট। 1.3817-এর উপরের সীমানা ভেদ করার ক্ষেত্রে, প্রবণতা পরিবর্তনের পূর্বাভাস
M5 এবং M15 টাইম ফ্রেমে আরও ভুল এন্ট্রি পয়েন্ট থাকতে পারে।
Open chart in a new window
ডাবল বটম
was formed on 05.05 at 12:20:14 (UTC+0)
signal strength 1 of 5
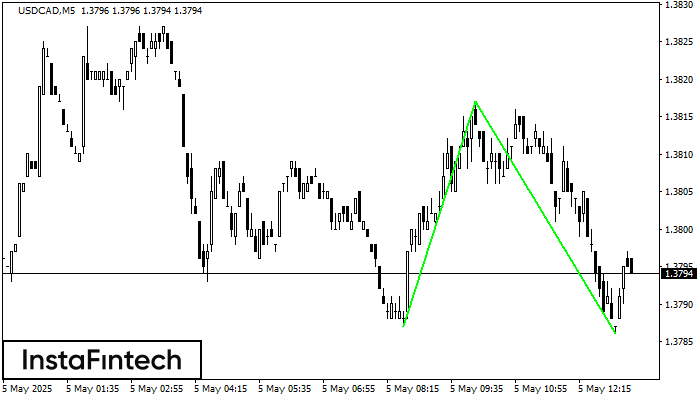
M5 চার্টে, USDCAD-এর ডাবল বটম প্যাটার্নটি গঠিত হয়েছে। উপরের সীমানা হল 1.3817; নীচের সীমানা হল 1.3786। প্যাটার্নের প্রস্থ হল 30 পয়েন্ট। 1.3817-এর উপরের সীমানা ভেদ করার ক্ষেত্রে, প্রবণতা পরিবর্তনের পূর্বাভাস
M5 এবং M15 টাইম ফ্রেমে আরও ভুল এন্ট্রি পয়েন্ট থাকতে পারে।
Open chart in a new window


