

Pola sebenarnya

Bearish Symmetrical Triangle
was formed on 26.03 at 00:39:05 (UTC+0)
signal strength 2 of 5
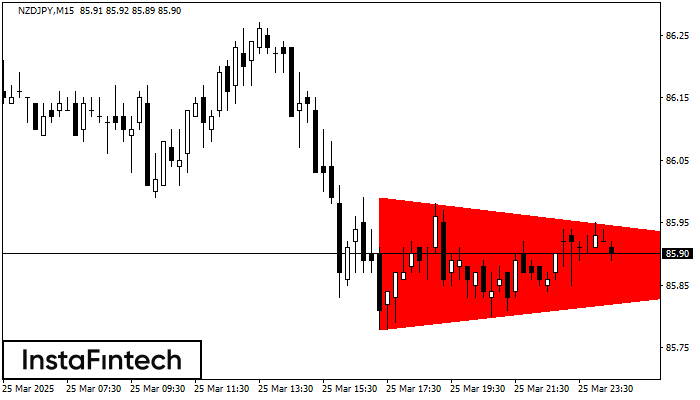
According to the chart of M15, NZDJPY formed the Bearish Symmetrical Triangle pattern. Description: The lower border is 85.78/85.88 and upper border is 85.99/85.88. The pattern width is measured on the chart at -21 pips. The formation of the Bearish Symmetrical Triangle pattern evidently signals a continuation of the downward trend. In other words, if the scenario comes true and NZDJPY breaches the lower border, the price could continue its move toward 85.65.
The M5 and M15 time frames may have more false entry points.
- All
- All
- Bearish Rectangle
- Bearish Symmetrical Triangle
- Bearish Symmetrical Triangle
- Bullish Rectangle
- Double Top
- Double Top
- Triple Bottom
- Triple Bottom
- Triple Top
- Triple Top
- All
- All
- Buy
- Sale
- All
- 1
- 2
- 3
- 4
- 5
Persegi Bearish
was formed on 06.05 at 23:56:04 (UTC+0)
signal strength 1 of 5
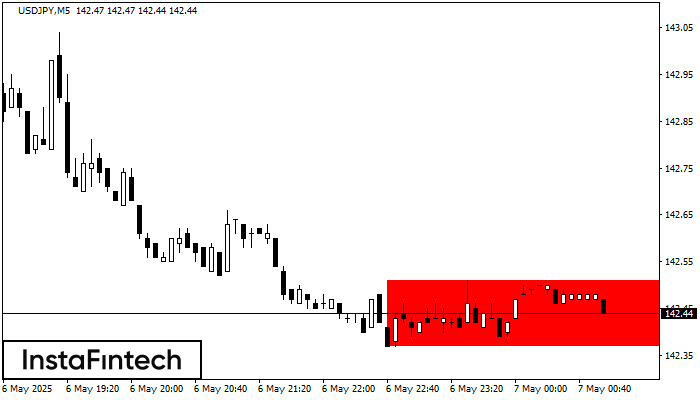
Menurut grafik dari M5, USDJPY terbentuk Persegi Bearish yang merupakan pola dari kelanjutan tren. Pola terkandung di dalam batas berikut: batas lebih rendah 142.37 – 142.37 dan batas atas 142.51
Rangka waktu M5 dan M15 mungkin memiliki lebih dari titik entri yang keliru.
Open chart in a new window
Kepala dan Bahu Terbalik
was formed on 06.05 at 23:38:00 (UTC+0)
signal strength 1 of 5
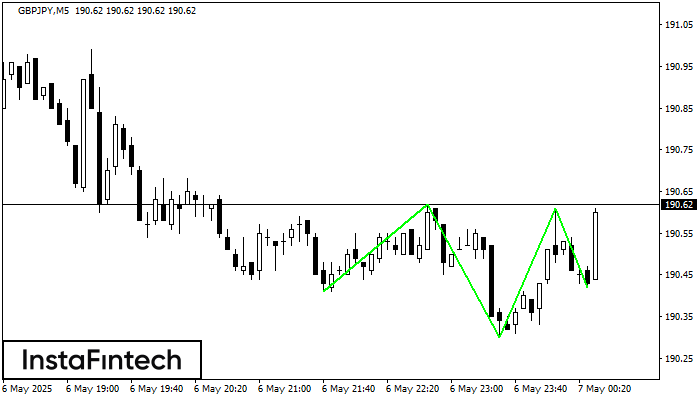
Menurut grafik M5, GBPJPY menghasilkan pola yang disebut Kepala dan Bahu Terbalik. The Head ditetapkan di 190.30 sementara garis median The Neck ditetapkan di 190.62/190.61. Formasi Pola Kepala dan Bahu
Rangka waktu M5 dan M15 mungkin memiliki lebih dari titik entri yang keliru.
Open chart in a new window
Teratas Ganda
was formed on 06.05 at 23:30:18 (UTC+0)
signal strength 2 of 5
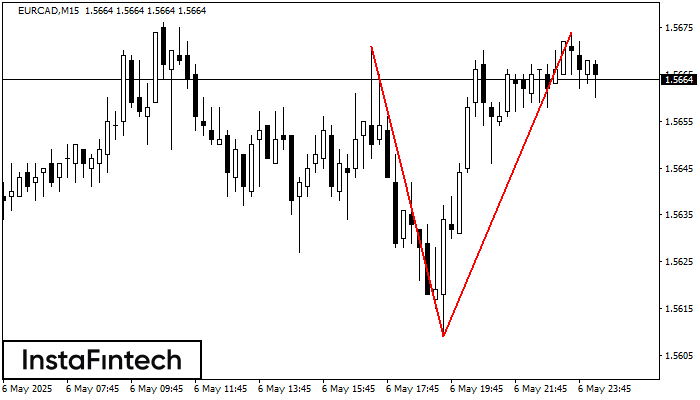
Pola Teratas Ganda telah terbentuk pada EURCAD M15. Pola ini menandakan bahwa tren telah berubah dari kenaikan menjadi penurunan. Mungkin, jika dasar pola di 1.5609 ditembus, maka pergerakan menurun akan
Rangka waktu M5 dan M15 mungkin memiliki lebih dari titik entri yang keliru.
Open chart in a new window


