

Pola sebenarnya

Bullish Symmetrical Triangle
was formed on 25.03 at 22:45:42 (UTC+0)
signal strength 1 of 5
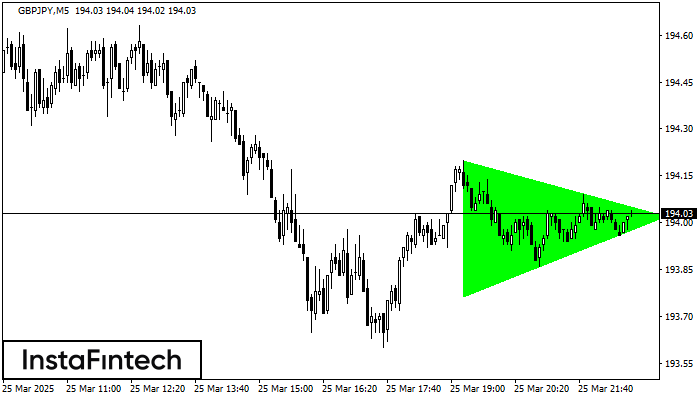
According to the chart of M5, GBPJPY formed the Bullish Symmetrical Triangle pattern, which signals the trend will continue. Description. The upper border of the pattern touches the coordinates 194.20/194.02 whereas the lower border goes across 193.77/194.02. The pattern width is measured on the chart at 43 pips. If the Bullish Symmetrical Triangle pattern is in progress during the upward trend, this indicates the current trend will go on. In case 194.02 is broken, the price could continue its move toward 194.17.
The M5 and M15 time frames may have more false entry points.
- All
- All
- Bearish Rectangle
- Bearish Symmetrical Triangle
- Bearish Symmetrical Triangle
- Bullish Rectangle
- Double Top
- Double Top
- Triple Bottom
- Triple Bottom
- Triple Top
- Triple Top
- All
- All
- Buy
- Sale
- All
- 1
- 2
- 3
- 4
- 5
Pennant Aliran Menaik
was formed on 09.05 at 17:14:50 (UTC+0)
signal strength 2 of 5
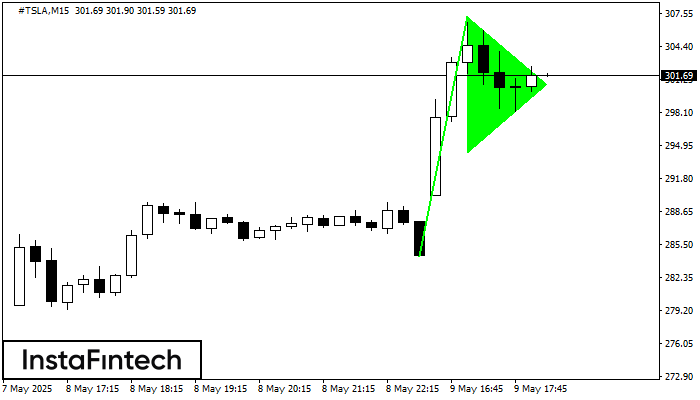
Isyarat Pennant Aliran Menaik – Instrumen dagangan #TSLA M15, corak kesinambungan. Ramalan: adalah mungkin untuk menetapkan kedudukan membeli di atas paras tinggi corak 307.26, dengan prospek pergerakan seterusnya menjadi unjuran
Carta masa M5 dan M15 mungkin mempunyai lebih banyak titik kemasukan palsu.
Open chart in a new window
Pennant Aliran Menaik
was formed on 09.05 at 17:14:41 (UTC+0)
signal strength 2 of 5

Corak Pennant Aliran Menaik adalah dibentuk pada carta #TSLA M15. Ia adalah jenis corak kesinambungan. Seandainya, sekiranya harga adalah tetap di atas paras tinggi Pennant 307.26, arah aliran menaik selanjutnya
Carta masa M5 dan M15 mungkin mempunyai lebih banyak titik kemasukan palsu.
Open chart in a new window
Double Top
was formed on 09.05 at 16:30:11 (UTC+0)
signal strength 3 of 5
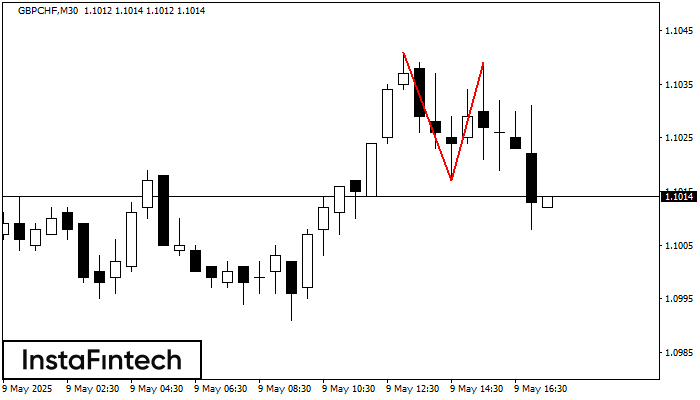
Corak pembalikan Double Top telah dibentuk pada GBPCHF M30. Ciri-ciri: sempadan atas %P0.000000; sempadan bawah 1.1041; sempadan bawah 1.1017; lebar corak adalah 22 mata. Dagangan menjual adalah lebih baik untuk
Open chart in a new window


