

Pola sebenarnya

Double Bottom
was formed on 25.03 at 22:00:47 (UTC+0)
signal strength 3 of 5
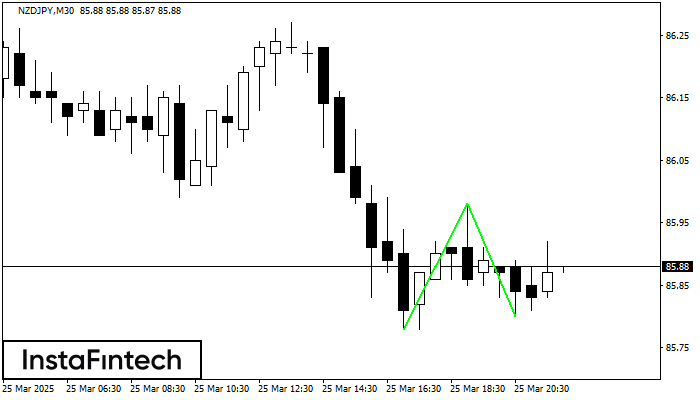
The Double Bottom pattern has been formed on NZDJPY M30. Characteristics: the support level 85.78; the resistance level 85.98; the width of the pattern 20 points. If the resistance level is broken, a change in the trend can be predicted with the first target point lying at the distance of 18 points.
Lihat juga
- All
- All
- Bearish Rectangle
- Bearish Symmetrical Triangle
- Bearish Symmetrical Triangle
- Bullish Rectangle
- Double Top
- Double Top
- Triple Bottom
- Triple Bottom
- Triple Top
- Triple Top
- All
- All
- Buy
- Sale
- All
- 1
- 2
- 3
- 4
- 5
Bullish Rectangle
сформирован 11.05 в 01:12:20 (UTC+0)
сила сигнала 1 из 5

According to the chart of M5, #Bitcoin formed the Bullish Rectangle. The pattern indicates a trend continuation. The upper border is 103800.29, the lower border is 103508.08. The signal means
The M5 and M15 time frames may have more false entry points.
Открыть график инструмента в новом окне
Double Top
сформирован 11.05 в 00:45:18 (UTC+0)
сила сигнала 1 из 5

On the chart of #Bitcoin M5 the Double Top reversal pattern has been formed. Characteristics: the upper boundary 103800.29; the lower boundary 103508.08; the width of the pattern 29221 points
The M5 and M15 time frames may have more false entry points.
Открыть график инструмента в новом окне
Bullish Rectangle
сформирован 09.05 в 22:57:29 (UTC+0)
сила сигнала 1 из 5

According to the chart of M5, GBPJPY formed the Bullish Rectangle. The pattern indicates a trend continuation. The upper border is 193.44, the lower border is 193.24. The signal means
The M5 and M15 time frames may have more false entry points.
Открыть график инструмента в новом окне


