

Pola sebenarnya

Bullish Rectangle
was formed on 25.03 at 20:59:12 (UTC+0)
signal strength 1 of 5
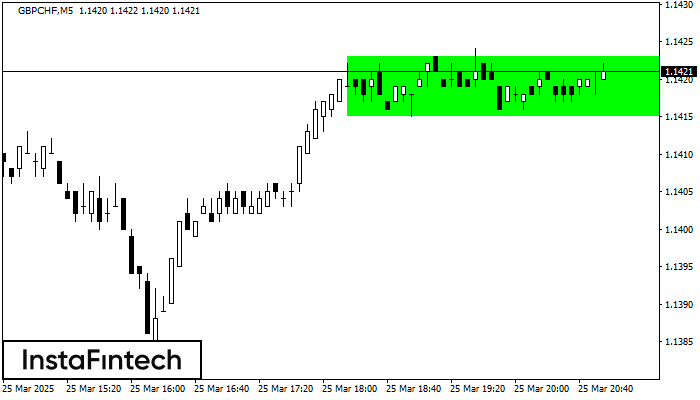
According to the chart of M5, GBPCHF formed the Bullish Rectangle. The pattern indicates a trend continuation. The upper border is 1.1423, the lower border is 1.1415. The signal means that a long position should be opened above the upper border 1.1423 of the Bullish Rectangle.
The M5 and M15 time frames may have more false entry points.
- All
- All
- Bearish Rectangle
- Bearish Symmetrical Triangle
- Bearish Symmetrical Triangle
- Bullish Rectangle
- Double Top
- Double Top
- Triple Bottom
- Triple Bottom
- Triple Top
- Triple Top
- All
- All
- Buy
- Sale
- All
- 1
- 2
- 3
- 4
- 5
Bawah Ganda
was formed on 07.05 at 10:00:56 (UTC+0)
signal strength 2 of 5
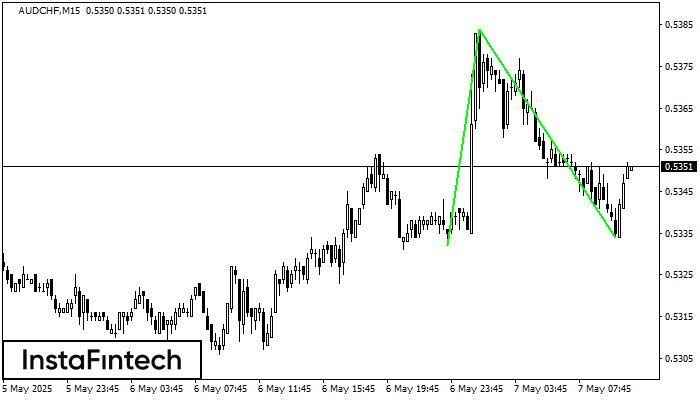
Pola Bawah Ganda telah terbentuk pada AUDCHF M15; batas atas di 0.5384; batas bawah di 0.5334. Lebar pola sebesar 52 poin. Jika harga menembus batas atas 0.5384, Perubahan dalam tren
Rangka waktu M5 dan M15 mungkin memiliki lebih dari titik entri yang keliru.
Open chart in a new window
Kepala dan Bahu Terbalik
was formed on 07.05 at 10:00:08 (UTC+0)
signal strength 3 of 5
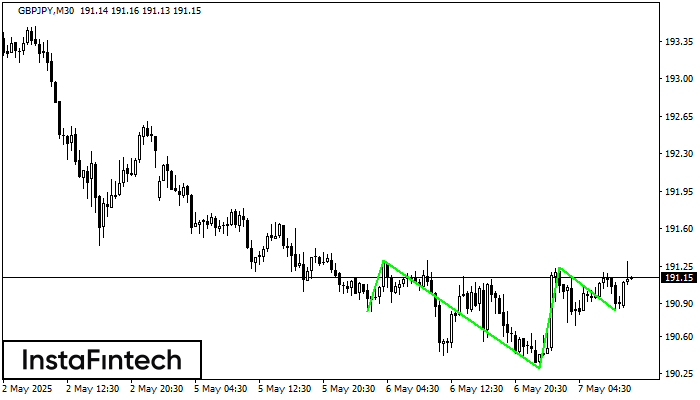
Menurut grafik M30, GBPJPY menghasilkan pola yang disebut Kepala dan Bahu Terbalik. The Head ditetapkan di 190.30 sementara garis median The Neck ditetapkan di 191.31/191.24. Formasi Pola Kepala dan Bahu
Open chart in a new window
Persegi Bullish
was formed on 07.05 at 09:17:35 (UTC+0)
signal strength 2 of 5
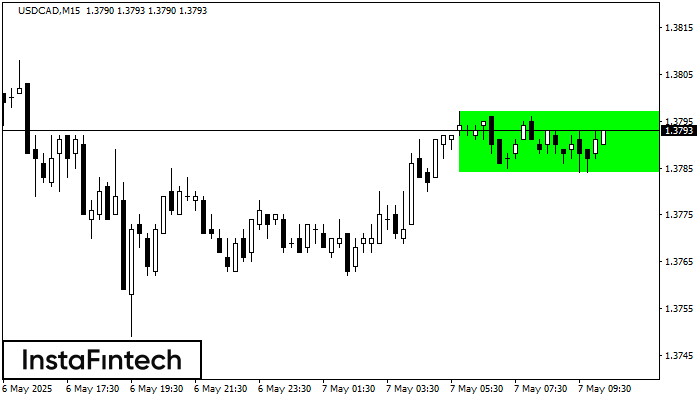
Menurut grafik dari M15, USDCAD terbentuk Persegi Bullish. Jenis pola ini menunjukkan kelanjutan tren. Terdiri dari dua tingkat: resistance 1.3797 dan support 1.3784. Jika level resistance 1.3797 - 1.3797 ditembus
Rangka waktu M5 dan M15 mungkin memiliki lebih dari titik entri yang keliru.
Open chart in a new window


