

Pola sebenarnya

Bullish Symmetrical Triangle
was formed on 25.03 at 20:05:23 (UTC+0)
signal strength 1 of 5
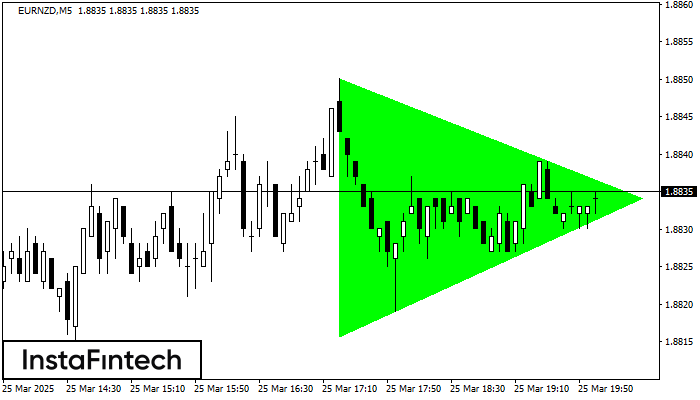
According to the chart of M5, EURNZD formed the Bullish Symmetrical Triangle pattern, which signals the trend will continue. Description. The upper border of the pattern touches the coordinates 1.8850/1.8834 whereas the lower border goes across 1.8816/1.8834. The pattern width is measured on the chart at 34 pips. If the Bullish Symmetrical Triangle pattern is in progress during the upward trend, this indicates the current trend will go on. In case 1.8834 is broken, the price could continue its move toward 1.8849.
The M5 and M15 time frames may have more false entry points.
- All
- All
- Bearish Rectangle
- Bearish Symmetrical Triangle
- Bearish Symmetrical Triangle
- Bullish Rectangle
- Double Top
- Double Top
- Triple Bottom
- Triple Bottom
- Triple Top
- Triple Top
- All
- All
- Buy
- Sale
- All
- 1
- 2
- 3
- 4
- 5
Teratas Triple
was formed on 05.05 at 10:59:43 (UTC+0)
signal strength 4 of 5
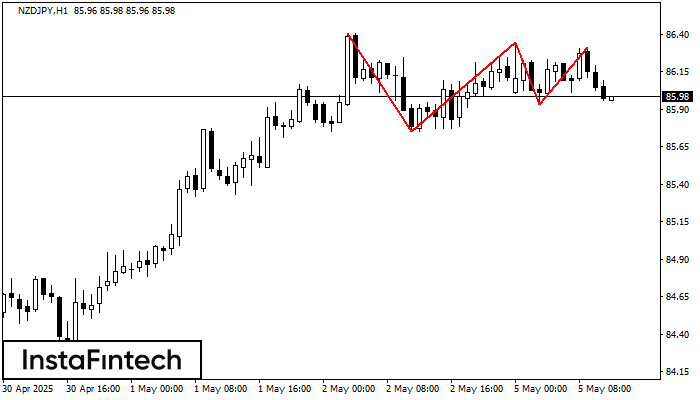
Pola Teratas Triple telah terbentuk pada grafik NZDJPY H1. Fitur-fitur pola: perbatasan memiliki sudut yang naik; batas bawah pola memiliki koordinat 85.75/85.93 dengan batas atas 86.40/86.31; proyeksi lebar adalah
Open chart in a new window
Persegi Bullish
was formed on 05.05 at 10:31:43 (UTC+0)
signal strength 1 of 5
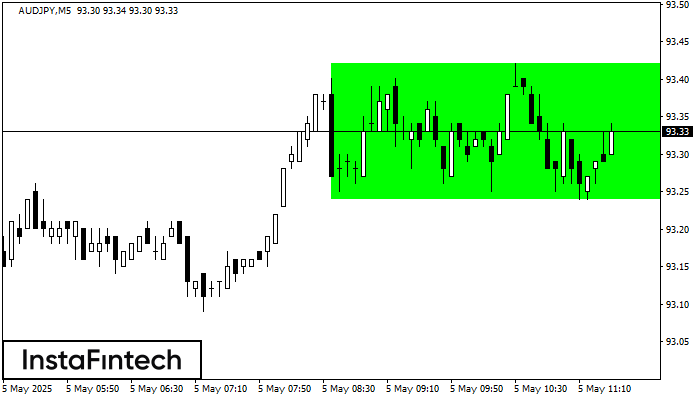
Menurut grafik dari M5, AUDJPY terbentuk Persegi Bullish. Pola menunjukkan kelanjutan tren. Batas atas adalah 93.42, batas lebih rendah adalah 93.24. Sinyal berarti posisi beli harus dibuka diatas batas atas
Rangka waktu M5 dan M15 mungkin memiliki lebih dari titik entri yang keliru.
Open chart in a new window
Bawah Triple
was formed on 05.05 at 10:00:09 (UTC+0)
signal strength 3 of 5
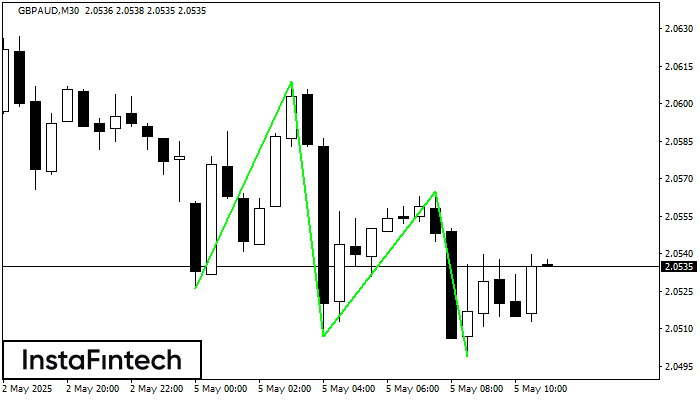
Pola Bawah Triple telah terbentuk pada grafik GBPAUD M30. Fitur-fitur pola: garis bawah pola memiliki koordinat 2.0609 dengan batas atas 2.0609/2.0565, proyeksi lebar adalah 83 poin. Pembentukan pola Bawah Triple
Open chart in a new window


