

Pola sebenarnya

Bearish Rectangle
was formed on 25.03 at 18:57:08 (UTC+0)
signal strength 1 of 5
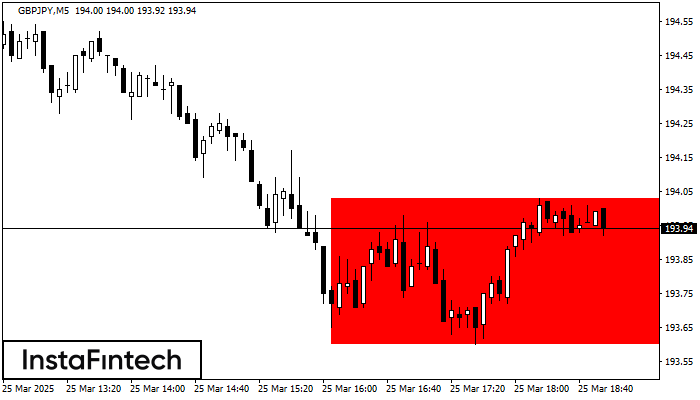
According to the chart of M5, GBPJPY formed the Bearish Rectangle which is a pattern of a trend continuation. The pattern is contained within the following borders: lower border 193.60 – 193.60 and upper border 194.03 – 194.03. In case the lower border is broken, the instrument is likely to follow the downward trend.
The M5 and M15 time frames may have more false entry points.
Lihat juga
- All
- All
- Bearish Rectangle
- Bearish Symmetrical Triangle
- Bearish Symmetrical Triangle
- Bullish Rectangle
- Double Top
- Double Top
- Triple Bottom
- Triple Bottom
- Triple Top
- Triple Top
- All
- All
- Buy
- Sale
- All
- 1
- 2
- 3
- 4
- 5
Persegi Bullish
was formed on 11.04 at 22:20:31 (UTC+0)
signal strength 1 of 5

Menurut grafik dari M5, NZDCHF terbentuk Persegi Bullish. Pola menunjukkan kelanjutan tren. Batas atas adalah 0.4754, batas lebih rendah adalah 0.4746. Sinyal berarti posisi beli harus dibuka diatas batas atas
Rangka waktu M5 dan M15 mungkin memiliki lebih dari titik entri yang keliru.
Open chart in a new window
Persegi Bearish
was formed on 11.04 at 22:10:27 (UTC+0)
signal strength 1 of 5

Menurut grafik dari M5, USDCAD terbentuk Persegi Bearish yang merupakan pola dari kelanjutan tren. Pola terkandung di dalam batas berikut: batas lebih rendah 1.3871 – 1.3871 dan batas atas 1.3891
Rangka waktu M5 dan M15 mungkin memiliki lebih dari titik entri yang keliru.
Open chart in a new window
Teratas Ganda
was formed on 11.04 at 22:10:22 (UTC+0)
signal strength 1 of 5

Pada grafik #Bitcoin M5 pola reversal Teratas Ganda telah terbentuk. Karakteristik: batas atas 83924.61; batas bawah 83599.60; lebar pola 32501 poin. Sinyal: tembusan ke batas bawah akan menyebabkan kelanjutan tren
Rangka waktu M5 dan M15 mungkin memiliki lebih dari titik entri yang keliru.
Open chart in a new window


