

Pola sebenarnya

Bearish Rectangle
was formed on 21.03 at 22:23:03 (UTC+0)
signal strength 2 of 5

According to the chart of M15, EURCHF formed the Bearish Rectangle which is a pattern of a trend continuation. The pattern is contained within the following borders: lower border 0.9539 – 0.9539 and upper border 0.9558 – 0.9558. In case the lower border is broken, the instrument is likely to follow the downward trend.
The M5 and M15 time frames may have more false entry points.
- All
- All
- Bearish Rectangle
- Bearish Symmetrical Triangle
- Bearish Symmetrical Triangle
- Bullish Rectangle
- Double Top
- Double Top
- Triple Bottom
- Triple Bottom
- Triple Top
- Triple Top
- All
- All
- Buy
- Sale
- All
- 1
- 2
- 3
- 4
- 5
Bearish Rectangle
сформирован 11.05 в 20:08:50 (UTC+0)
сила сигнала 1 из 5
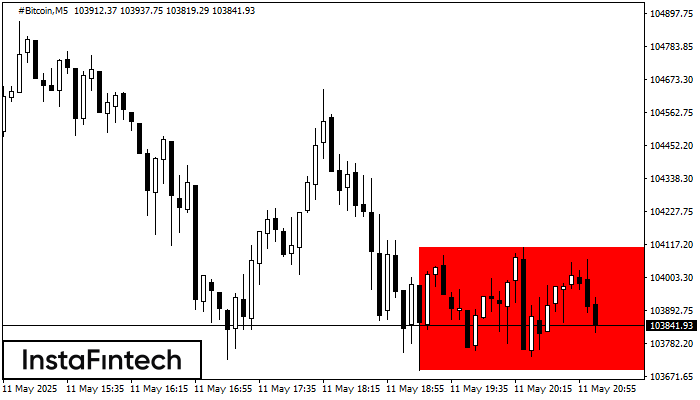
According to the chart of M5, #Bitcoin formed the Bearish Rectangle which is a pattern of a trend continuation. The pattern is contained within the following borders: lower border 103691.15
The M5 and M15 time frames may have more false entry points.
Открыть график инструмента в новом окне
Triple Bottom
сформирован 11.05 в 19:05:15 (UTC+0)
сила сигнала 1 из 5
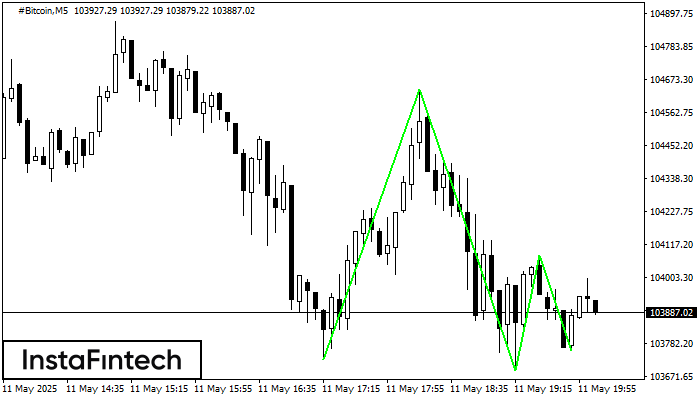
The Triple Bottom pattern has formed on the chart of #Bitcoin M5. Features of the pattern: The lower line of the pattern has coordinates 104640.24 with the upper limit 104640.24/104078.48
The M5 and M15 time frames may have more false entry points.
Открыть график инструмента в новом окне
Double Bottom
сформирован 11.05 в 18:30:15 (UTC+0)
сила сигнала 1 из 5

The Double Bottom pattern has been formed on #Bitcoin M5; the upper boundary is 104640.24; the lower boundary is 103691.15. The width of the pattern is 91343 points. In case
The M5 and M15 time frames may have more false entry points.
Открыть график инструмента в новом окне


