

Pola sebenarnya

Double Top
was formed on 21.03 at 21:20:50 (UTC+0)
signal strength 1 of 5
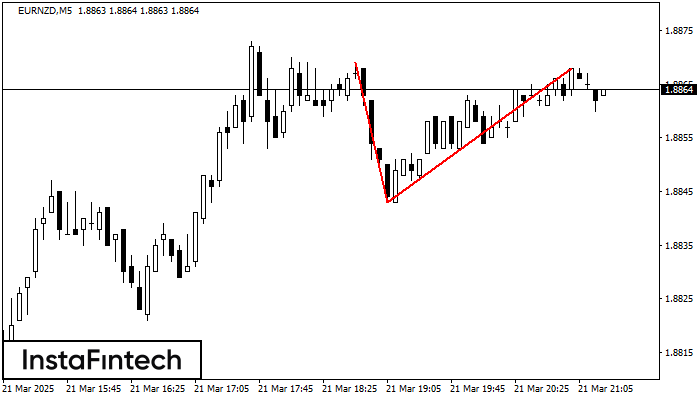
The Double Top reversal pattern has been formed on EURNZD M5. Characteristics: the upper boundary 1.8869; the lower boundary 1.8843; the width of the pattern is 25 points. Sell trades are better to be opened below the lower boundary 1.8843 with a possible movements towards the 1.8828 level.
The M5 and M15 time frames may have more false entry points.
Lihat juga
- All
- All
- Bearish Rectangle
- Bearish Symmetrical Triangle
- Bearish Symmetrical Triangle
- Bullish Rectangle
- Double Top
- Double Top
- Triple Bottom
- Triple Bottom
- Triple Top
- Triple Top
- All
- All
- Buy
- Sale
- All
- 1
- 2
- 3
- 4
- 5
Double Bottom
was formed on 05.05 at 13:00:02 (UTC+0)
signal strength 2 of 5
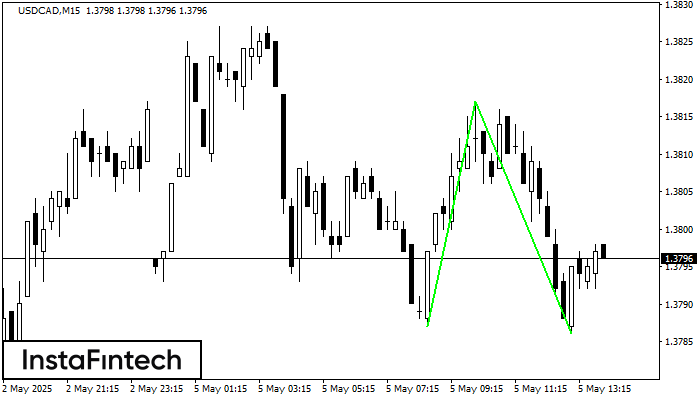
The Double Bottom pattern has been formed on USDCAD M15; the upper boundary is 1.3817; the lower boundary is 1.3786. The width of the pattern is 30 points. In case
The M5 and M15 time frames may have more false entry points.
Open chart in a new window
Double Bottom
was formed on 05.05 at 12:20:14 (UTC+0)
signal strength 1 of 5
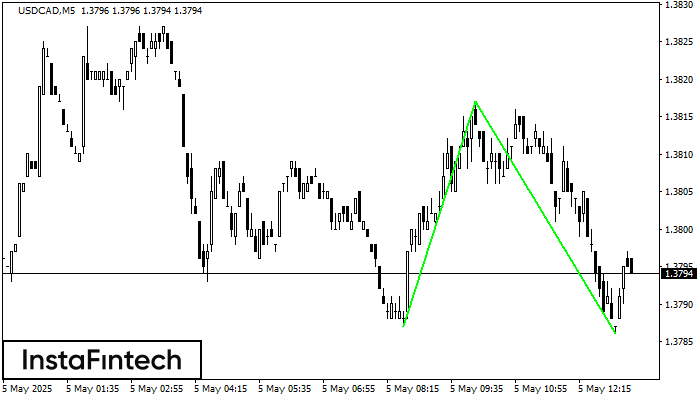
The Double Bottom pattern has been formed on USDCAD M5; the upper boundary is 1.3817; the lower boundary is 1.3786. The width of the pattern is 30 points. In case
The M5 and M15 time frames may have more false entry points.
Open chart in a new window
Double Top
was formed on 05.05 at 12:19:52 (UTC+0)
signal strength 1 of 5
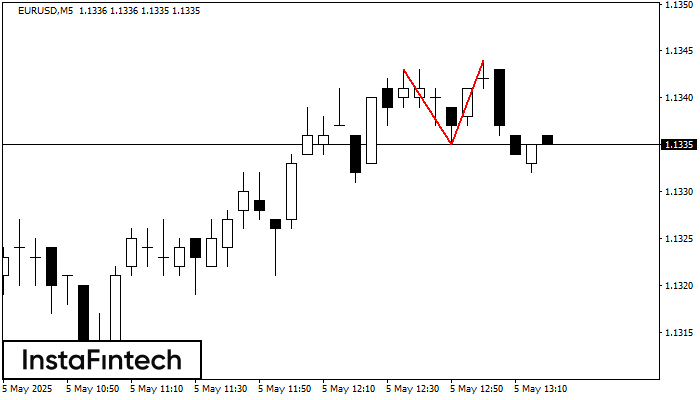
On the chart of EURUSD M5 the Double Top reversal pattern has been formed. Characteristics: the upper boundary 1.1344; the lower boundary 1.1335; the width of the pattern 9 points
The M5 and M15 time frames may have more false entry points.
Open chart in a new window


