Lihat juga


 03.04.2025 05:07 AM
USD/JPY
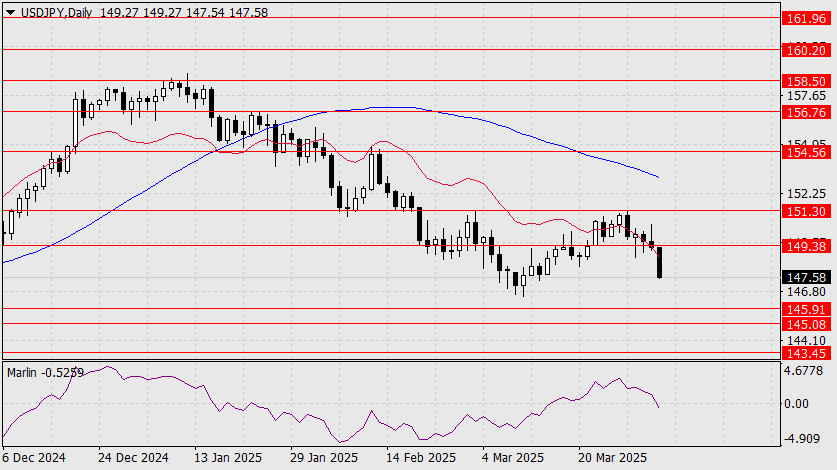
After Washington imposed a 24% tariff on Japanese imports, the Nikkei 225 has decreased by 2.71% during today's Pacific session. The USD/JPY pair is falling by roughly 150 pips.
On the daily chart, the signal line of the Marlin oscillator is crossing into bearish territory, opening the door for a deeper decline. The price has dropped below the balance line and remains below it. The first target is the 145.08–144.91 range, followed by support at 143.45 — the low from August 26, 2024.
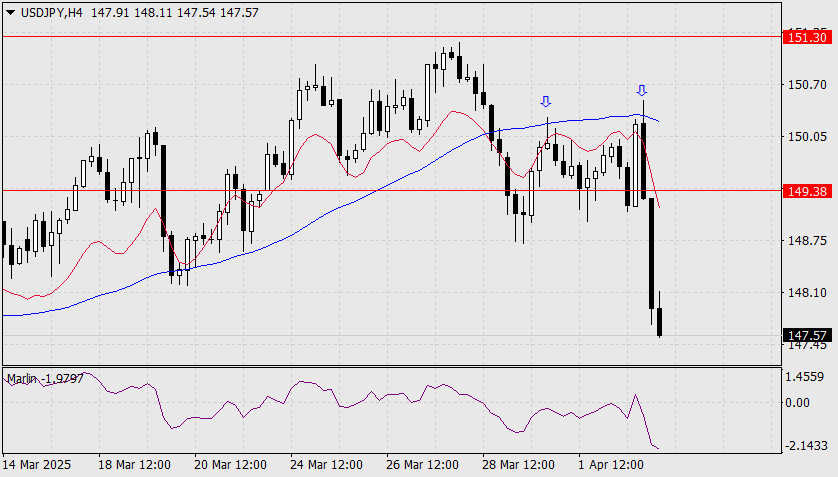
On the four-hour chart, the price decline began after a second reversal from the MACD indicator line. As of now, the price has consolidated below the 149.38 support level. The Marlin oscillator has deeply entered the negative zone, nearing oversold conditions, which may lead to a slowdown in the decline and some consolidation before reaching the 145.08–144.91 target range.
You have already liked this post today
*Analisis pasar yang diposting disini dimaksudkan untuk meningkatkan pengetahuan Anda namun tidak untuk memberi instruksi trading.
Harga emas belakangan ini mengalami koreksi yang signifikan di tengah ekspektasi pasar akan dimulainya negosiasi nyata antara AS dan Tiongkok mengenai tarif dan perdagangan secara keseluruhan. Pernyataan Menteri Keuangan
Meski di chart 4 jamnya indeks Nasdaq 100 tengah Sideways, namun kisarannya cukup besar sehingga masih ada peluang yang cukup menjanjikan di indeks tersebut. Saat ini indikator Stochastic Oscillator tengah
Pada chart 4 jamnya, instrument komoditi Perak nampak terlihat meski kondisinya tengah menguat di mana hal ini terkonfirmasi oleh pergerakan harga Perak yang bergerak diatas WMA (30 Shift 2) yang
Rencana trading kami untuk beberapa jam ke depan adalah menjual emas di bawah $3.333, dengan target di $3.313 dan $3.291. Kami dapat membeli di atas $3.280 dengan target jangka pendek
Dengan munculnya Divergence antara pergerakan harga pasangan mata uang silang AUD/JPY dengan indikator Stochastic Oscillator serta pergerakan harga AUD/JPY yang berada diatas WMA (30 Shift 2) yang juga memiliki kemiringan
Bila Kita perhatikan pada chart 4 jamnya, instrumen komoditi Emas nampak terlihat masih bergerak dalam bias yang Bullish, namun dengan kemunculan Divergence antara pergerakan harga Emas dengan indikator Stochastic Oscillator
Dengan pergerakan harga pasangan mata uang silang AUD/CAD yang bergerak diatas WMA (21) yang memiliki kemiringan yang menukik keatas serta munculnya Convergence antara pergerakan harga AUD/CAD dengan indikator Stochastic Oscillator
Bila Kita perhatikan chart 4 jam dari pasangan mata uang silang GBP/CHF, maka nampak ada beberapa fakta-fakta yang menari. Pertama, munculnya pola Triangle yang diikuti oleh pergerakan EMA (21)-nya yang
Indikator eagle telah mencapai level overbought. Namun, logam ini masih bisa mencapai level tinggi di sekitar 8/8 Murray, yang merupakan penghalang kuat bagi emas. Di bawah area ini, kita bisa
Dengan munculnya Konvergensi antara pergerakan harga pasangan mata uang utama USD/JPY dengan indikator Stochastic Oscillator serta posisi EMA (100) yang berada diatas harga, maka dalam waktu dekat ini USD/JPY berpotensi
Klub InstaTrade

Your IP address shows that you are currently located in the USA. If you are a resident of the United States, you are prohibited from using the services of InstaFintech Group including online trading, online transfers, deposit/withdrawal of funds, etc.
If you think you are seeing this message by mistake and your location is not the US, kindly proceed to the website. Otherwise, you must leave the website in order to comply with government restrictions.
Why does your IP address show your location as the USA?
Please confirm whether you are a US resident or not by clicking the relevant button below. If you choose the wrong option, being a US resident, you will not be able to open an account with InstaTrade anyway.
We are sorry for any inconvenience caused by this message.


