Lihat juga


 01.04.2025 07:31 PM
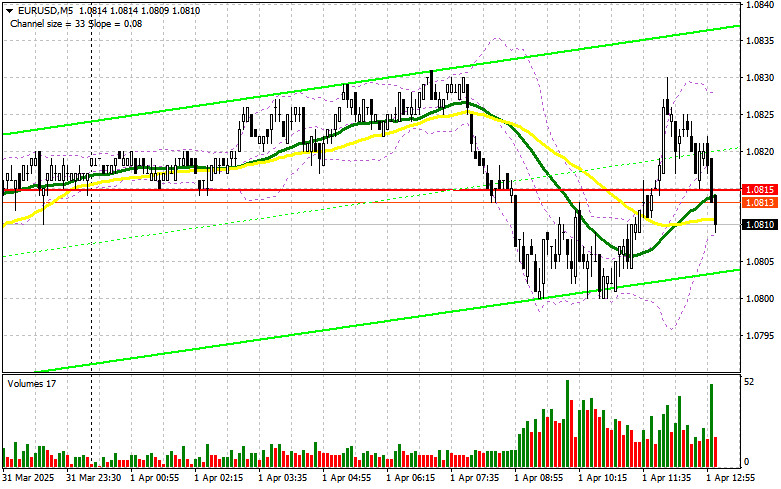
In my morning forecast, I highlighted the level of 1.0815 and planned to make market entry decisions based on it. Let's look at the 5-minute chart and analyze what happened there. A decline did occur, but there was no formation of a false breakout, so no entry point was confirmed. The technical outlook was revised for the second half of the day.
To open long positions on EUR/USD:
Rather weak data on manufacturing activity in Eurozone countries understandably did not support the euro in the first half of the day. In the second half, similar data will be released in the U.S., including the ISM Manufacturing PMI, JOLTS job openings data from the Bureau of Labor Statistics, and a speech from FOMC member Thomas Barkin. A hawkish tone from the Fed representative—especially ahead of tomorrow's crucial announcements—could support the dollar.
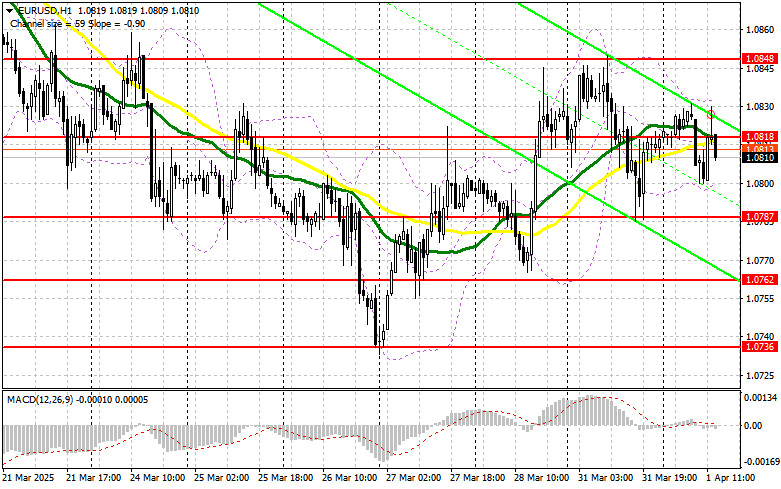
If the euro declines after the reports, only a false breakout around the 1.0787 support level will serve as a signal for new long positions in EUR/USD, aiming for a return of the bullish trend and a retest of 1.0818. A breakout and retest of this range will confirm a valid entry point for buying with a target of 1.0848. The ultimate target will be 1.0884, where I will take profit.
If EUR/USD declines and there is no activity around 1.0787, pressure on the euro will intensify. In this case, sellers could push the pair down to 1.0762. Only after a false breakout form will I consider buying the euro. I also plan to open long positions on a rebound from 1.0736 with a target of a 30–35 point intraday correction.
To open short positions on EUR/USD:
Sellers made a comeback, but the pair didn't break out of the newly formed sideways channel—and it likely won't. Everyone is awaiting Trump's tariff announcements, so the dollar is more likely to be in demand than risk assets. If the U.S. PMI data triggers a negative market reaction, only a false breakout near the 1.0818 resistance level—which earlier acted as support—will provide a signal for short positions with a target of another move toward 1.0787. A breakout and consolidation below this range will be a suitable selling opportunity, targeting 1.0762. The ultimate target will be 1.0736, where I will take profit.
If EUR/USD rises in the second half of the day and bears fail to act around 1.0818—where the moving averages are—buyers could gain control and push the pair higher. In that case, I will delay short positions until a test of the next resistance at 1.0848, and only sell after a failed consolidation attempt. I plan to open short positions on a rebound from 1.0884, targeting a 30–35 point intraday correction.
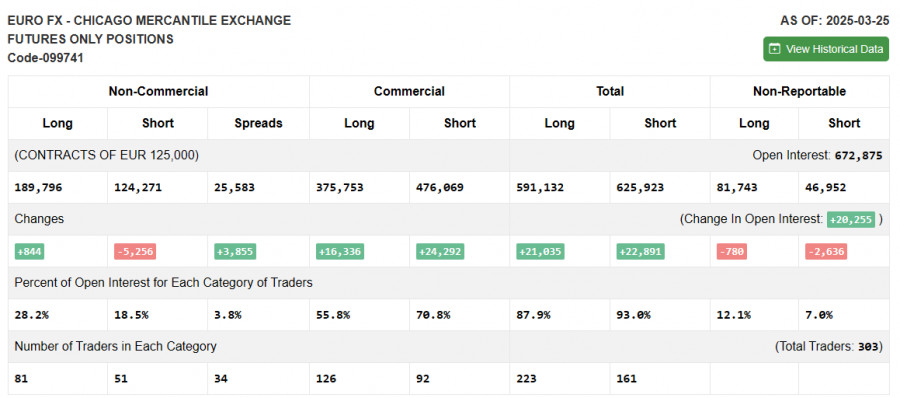
In the COT report (Commitments of Traders) for March 25, there was a slight increase in long positions and a rather significant decrease in shorts. There is no noticeable increase in euro buyers, but sellers continue to exit the market. Given the recent Eurozone inflation data and statements from ECB officials, the regulator's stance is likely to remain unchanged at the April meeting, which may temporarily support the euro. However, much will depend on the extent to which U.S. tariffs affect other countries. The more serious the threat of global economic slowdown, the greater the pressure will be on risk assets, including the euro.
The COT report shows that long non-commercial positions rose by 844 to 189,796, while short non-commercial positions dropped by 5,256 to 124,271. As a result, the gap between long and short positions increased by 3,855.
Indicator signals:
Moving averages: Trading is occurring around the 30- and 50-day moving averages, indicating a sideways market.
Note: The period and prices of the moving averages are considered by the author on the hourly H1 chart and may differ from the classical daily moving averages on the D1 chart.
Bollinger Bands: In case of a decline, the lower boundary of the indicator around 1.0800 will serve as support.
Indicator descriptions:
You have already liked this post today
*Analisis pasar yang diposting disini dimaksudkan untuk meningkatkan pengetahuan Anda namun tidak untuk memberi instruksi trading.
Pada hari Senin, pasangan GBP/USD mencapai 1,3580 — level yang belum pernah dicapai pound Inggris dalam lebih dari tiga tahun. Seperti yang telah kami katakan, pound hanya bisa berterima kasih
Pada hari Senin, pasangan mata uang EUR/USD melanjutkan pergerakan naik yang telah dimulai sejak hari Jumat. Hanya pada paruh kedua hari itu terjadi sedikit penurunan, yang dipicu oleh keputusan Trump
Pada hari Senin, pasangan mata uang GBP/USD juga diperdagangkan lebih tinggi, meskipun sempat mundur sedikit sepanjang hari. Penurunan ini terjadi setelah pengumuman bahwa kenaikan tarif untuk Uni Eropa ditunda dari
Pada hari Senin, pasangan mata uang EUR/USD awalnya naik setelah pengumuman Trump bahwa tarif pada barang-barang Uni Eropa akan meningkat menjadi 50% mulai 1 Juni. Namun, pasangan ini kemudian turun
Dalam prediksi pagi saya, saya fokus pada level 1,3570 dan merencanakan keputusan masuk di sekitar level tersebut. Mari kita lihat grafik 5 menit dan analisis apa yang terjadi. Penurunan
Dalam prediksi pagi saya, saya memfokuskan pada level 1,1416 sebagai area kunci untuk membuat keputusan perdagangan. Mari kita lihat grafik 5 menit dan analisis apa yang terjadi. Setelah kenaikan
Pada hari Jumat, pasangan GBP/USD juga menunjukkan pergerakan naik yang meyakinkan, didorong oleh tren naik keseluruhan yang diamati selama dua minggu terakhir dan dipicu oleh keputusan Donald Trump untuk menaikkan
Pada hari Jumat, pasangan mata uang EUR/USD melanjutkan pergerakan naiknya setelah memantul dari level 1,1267 selama koreksi singkat. Tren naik tetap utuh, seperti yang ditunjukkan oleh garis tren, dan dolar
Pasangan mata uang GBP/USD membentuk breakout dari channel mendatar melalui batas atas, berhenti sejenak untuk "memikirkannya", menunggu langkah agresif baru dari Trump, dan kemudian dengan meyakinkan beralih membentuk lonjakan naik
Pada hari Jumat, pasangan mata uang EUR/USD trading lebih tinggi. Dolar telah mengalami penurunan selama dua minggu berturut-turut, dan pasar menunjukkan keinginan yang tak henti-hentinya untuk melanjutkan tren naik yang
Ferrari F8 TRIBUTO
dari InstaTrade
InstaTrade dalam angka

Your IP address shows that you are currently located in the USA. If you are a resident of the United States, you are prohibited from using the services of InstaFintech Group including online trading, online transfers, deposit/withdrawal of funds, etc.
If you think you are seeing this message by mistake and your location is not the US, kindly proceed to the website. Otherwise, you must leave the website in order to comply with government restrictions.
Why does your IP address show your location as the USA?
Please confirm whether you are a US resident or not by clicking the relevant button below. If you choose the wrong option, being a US resident, you will not be able to open an account with InstaTrade anyway.
We are sorry for any inconvenience caused by this message.


