Lihat juga


 01.04.2025 03:04 PM
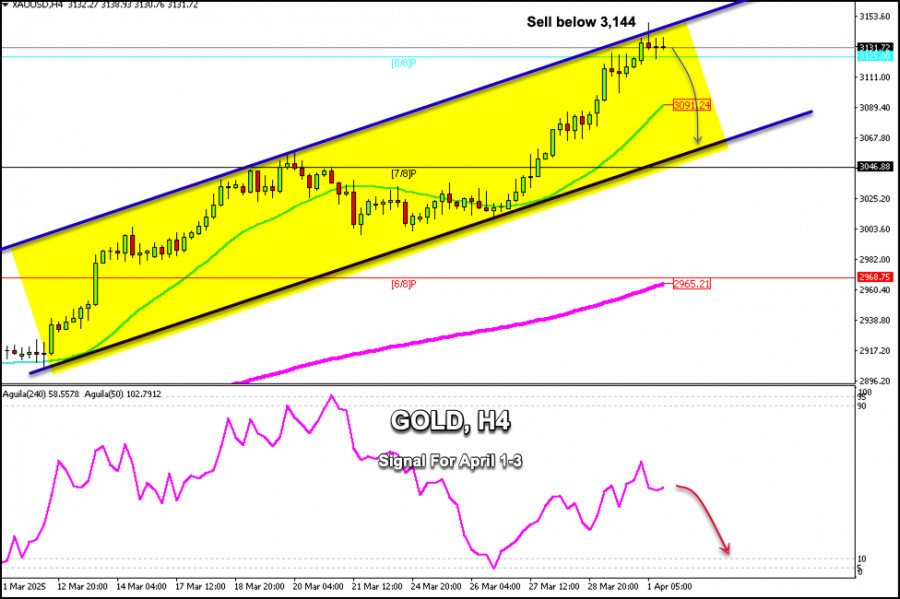
Early in the American session, gold is trading around 3,131 within the uptrend channel that has formed since March 11, reaching high overbought levels. A strong technical correction is expected to occur in the coming hours toward the 21st SMA located at 3,091. The price could even reach the bottom of the uptrend channel around 3,065.
The gold price reached a new all-time high at 3,149 during the European session. It is now undergoing a technical correction. The downward move is likely to continue during the American session until the price reaches the support at 3,115.
If gold attempts to break above its high, we should expect it to challenge the top of the uptrend channel around 3,144 once again. If gold fails to break this zone, it will be seen as a selling opportunity.
On the other hand, if the price consolidates below the 8/8 Murray level at 3,125, the outlook will be negative. So, we believe the instrument could reach 3,091 in the short term and eventually climb to the 7/8 Murray level at 3,046.
Our trading plan for the next few hours is to sell gold below 3,144 with targets at 3,125, 3,091 and finally, 3,070. The eagle indicator is showing a negative signal, which supports our bearish strategy.
You have already liked this post today
*Analisis pasar yang diposting disini dimaksudkan untuk meningkatkan pengetahuan Anda namun tidak untuk memberi instruksi trading.
Dengan munculnya Divergence antara pergerakan harga pasangan mata uang silang AUD/JPY dengan indikator Stochastic Oscillator serta pergerakan harga AUD/JPY yang berada diatas WMA (30 Shift 2) yang juga memiliki kemiringan
Bila Kita perhatikan pada chart 4 jamnya, instrumen komoditi Emas nampak terlihat masih bergerak dalam bias yang Bullish, namun dengan kemunculan Divergence antara pergerakan harga Emas dengan indikator Stochastic Oscillator
Dengan pergerakan harga pasangan mata uang silang AUD/CAD yang bergerak diatas WMA (21) yang memiliki kemiringan yang menukik keatas serta munculnya Convergence antara pergerakan harga AUD/CAD dengan indikator Stochastic Oscillator
Bila Kita perhatikan chart 4 jam dari pasangan mata uang silang GBP/CHF, maka nampak ada beberapa fakta-fakta yang menari. Pertama, munculnya pola Triangle yang diikuti oleh pergerakan EMA (21)-nya yang
Indikator eagle telah mencapai level overbought. Namun, logam ini masih bisa mencapai level tinggi di sekitar 8/8 Murray, yang merupakan penghalang kuat bagi emas. Di bawah area ini, kita bisa
Dengan munculnya Konvergensi antara pergerakan harga pasangan mata uang utama USD/JPY dengan indikator Stochastic Oscillator serta posisi EMA (100) yang berada diatas harga, maka dalam waktu dekat ini USD/JPY berpotensi
Dari apa yang terlihat di chart 4 jamnya pasangan mata uang silang EUR/GBP, nampak terlihat pergerakan harganya bergerak diatas EMA (100) dimana ini menandakan Buyers yang mendominasi pasangan mata uang
Harga emas terus mendapatkan dukungan di tengah ketidakpastian yang menyelimuti masa depan perang tarif yang diprakarsai oleh Donald Trump. Harga emas telah naik hampir secara vertikal selama empat bulan. Pendorong
Your IP address shows that you are currently located in the USA. If you are a resident of the United States, you are prohibited from using the services of InstaFintech Group including online trading, online transfers, deposit/withdrawal of funds, etc.
If you think you are seeing this message by mistake and your location is not the US, kindly proceed to the website. Otherwise, you must leave the website in order to comply with government restrictions.
Why does your IP address show your location as the USA?
Please confirm whether you are a US resident or not by clicking the relevant button below. If you choose the wrong option, being a US resident, you will not be able to open an account with InstaTrade anyway.
We are sorry for any inconvenience caused by this message.

