Lihat juga


 11.07.2022 02:47 PM
Hello, dear traders!
Let's start today's review of the GBP/USD pair with the fact that the UK is expected to have serious problems in the coming winter period. The point is that energy prices are so high that the traditionally prosperous British will face tough times. While British Prime Minister Boris Johnson continues to dance to the tune of the United States, Great Britain risks being left without the necessary heating. In other words, Britain is braced for a cold winter, during which its citizens will have to hide under duvets and rugs. All this stems from the government's extremely aggressive policy regarding sanctions against Russia. Now let's consider the situation from a technical point of view, starting with the analysis of the previous trading week.
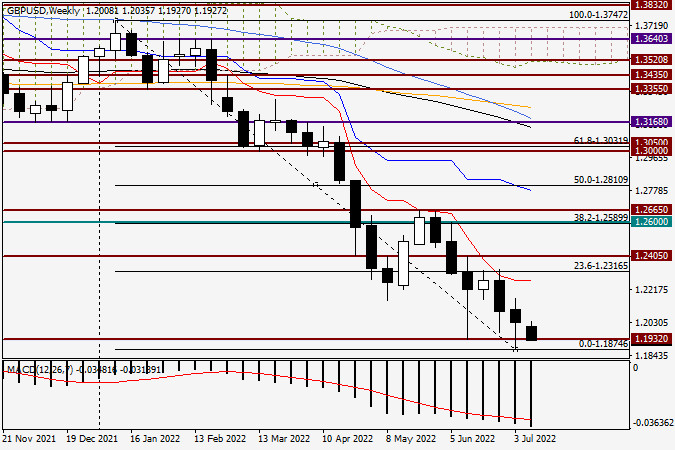
Weekly chart
Last week, pound bulls managed to turn the tide in their favor. This can be confirmed by the last weekly candlestick with a long lower shadow and a bullish body. After the formation of such candlesticks, the quote usually rises. However, this is not the case. The pound sterling is still trading under strong selling pressure against the US dollar. It is quite difficult to guess what will happen next. However, I still believe that the most likely scenario in the short term is bullish. If the pound sterling breaks through the support level of 1.1874, this scenario will be canceled. In the meantime, I expect the GBP/USD pair to form reversal candlestick signals at the bottom of the market. In this case, it will be possible to open long positions on the British pound. That's all for today. Tomorrow we will consider the pair's dynamics from a technical point of view on smaller time frames.
Have a good day!
You have already liked this post today
*Analisis pasar yang diposting disini dimaksudkan untuk meningkatkan pengetahuan Anda namun tidak untuk memberi instruksi trading.
Pada grafik per jam, pasangan GBP/USD tidak menunjukkan minat untuk bergerak pada hari Selasa. Sepanjang hari, bull dan bear melancarkan serangan lemah, yang tidak menghasilkan sesuatu yang signifikan. Pergerakannya horizontal
Meski di chart 4 jamnya AUD/JPY berpotensi untuk terkoreksi melemah dimana hal ini dikonfirmasi oleh kondisi indikator Stochastic Oscillator yang berada dalam kondisi Overbought, namun selama koreksi tersebut tidak tembus
Dari yang dapat Kita lihat di chart 4 jam pada instrumen komoditi Perak, nampak terlihat indikator Stochastic Oscillator sudah berada dalam kondisi Overbought sehingga dalam waktu dekat ini Perak berpotensi
Bila Kita perhatikan chart 4 jamnya pasangan mata uang silang EUR/JPY yang bergerak dibawah WMA (21) yang juga memiliki kemiringan menurun serta munculnya Convergence antara pergerakan harga EUR/JPY dengan indikator
Your IP address shows that you are currently located in the USA. If you are a resident of the United States, you are prohibited from using the services of InstaFintech Group including online trading, online transfers, deposit/withdrawal of funds, etc.
If you think you are seeing this message by mistake and your location is not the US, kindly proceed to the website. Otherwise, you must leave the website in order to comply with government restrictions.
Why does your IP address show your location as the USA?
Please confirm whether you are a US resident or not by clicking the relevant button below. If you choose the wrong option, being a US resident, you will not be able to open an account with InstaTrade anyway.
We are sorry for any inconvenience caused by this message.

