

Actual patterns

Patterns are graphical models which are formed in the chart by the price. According to one of the technical analysis postulates, history (price movement) repeats itself. It means that the price movements are often similar in the same situations which makes it possible to predict the further development of the situation with a high probability.
Relevant patterns by InstaTrade is an easy-to-use service which allows you to be aware of latest changes in the market and react to clues from the market in time. In our service you will always find the latest and most relevant patterns on any pair and any timeframe.
Bullish pennant
was formed on 14.04 at 16:00:24 (UTC+0)
signal strength 1 of 5
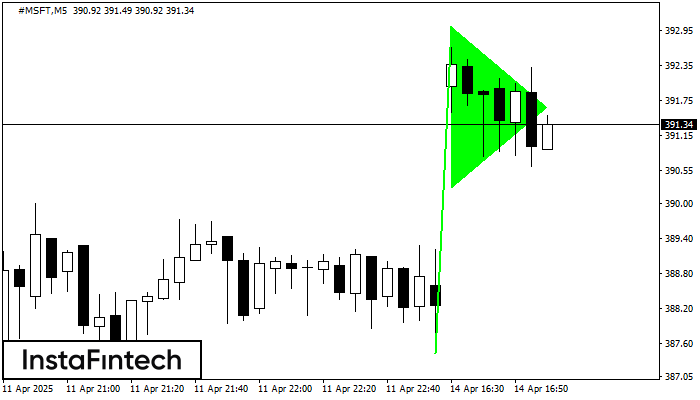
The Bullish pennant pattern is formed on the #MSFT M5 chart. It is a type of the continuation pattern. Supposedly, in case the price is fixed above the pennant’s high of 393.01, a further uptrend is possible.
The M5 and M15 time frames may have more false entry points.
- All
- All
- Bearish Rectangle
- Bearish Symmetrical Triangle
- Bearish Symmetrical Triangle
- Bullish Rectangle
- Double Top
- Double Top
- Triple Bottom
- Triple Bottom
- Triple Top
- Triple Top
- All
- All
- Buy
- Sale
- All
- 1
- 2
- 3
- 4
- 5
Bawah Triple
was formed on 21.05 at 10:00:16 (UTC+0)
signal strength 4 of 5
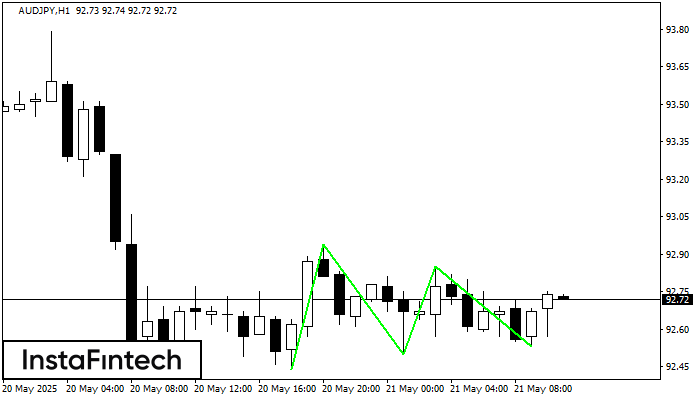
Pola Bawah Triple telah terbentuk pada AUDJPY H1. Pola tersebut memiliki karakteristik sebagai berikut: level resistance 92.94/92.85; level support 92.44/92.53; dengan lebar 50 poin. Jika terjadi pemecahan (breakdown) pada level
Open chart in a new window
Bawah Ganda
was formed on 21.05 at 10:00:05 (UTC+0)
signal strength 3 of 5
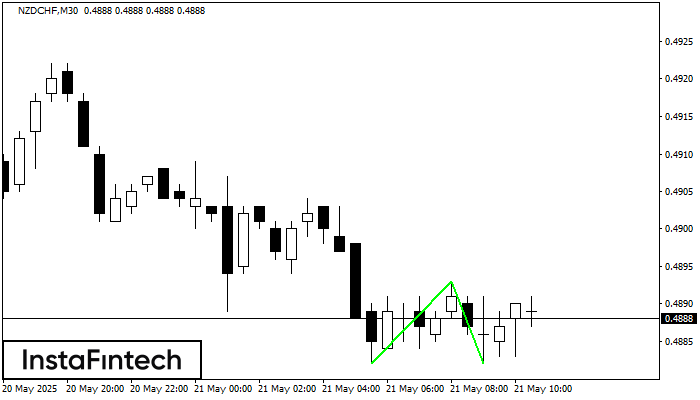
Pola Bawah Ganda telah terbentuk pada NZDCHF M30. Karakteristik: level support 0.4882; level resistance 0.4893; lebar pola 11 poin. Jika level resistance ditembus, perubahan dalam tren dapat diprediksi dengan target
Open chart in a new window
Bawah Ganda
was formed on 21.05 at 09:30:46 (UTC+0)
signal strength 2 of 5
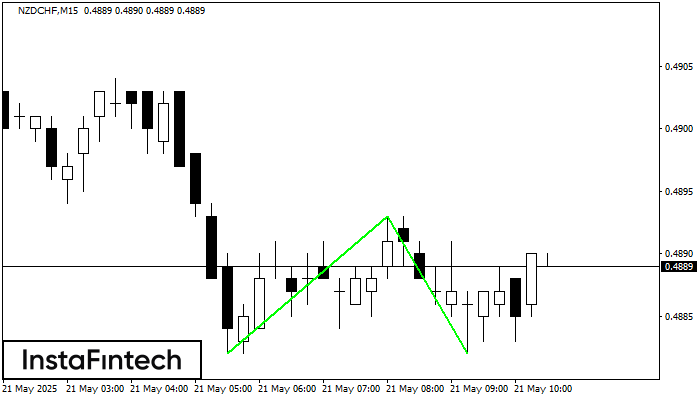
Pola Bawah Ganda telah terbentuk pada NZDCHF M15. Karakteristik: level support 0.4882; level resistance 0.4893; lebar pola 11 poin. Jika level resistance ditembus, perubahan dalam tren dapat diprediksi dengan target
Rangka waktu M5 dan M15 mungkin memiliki lebih dari titik entri yang keliru.
Open chart in a new window


